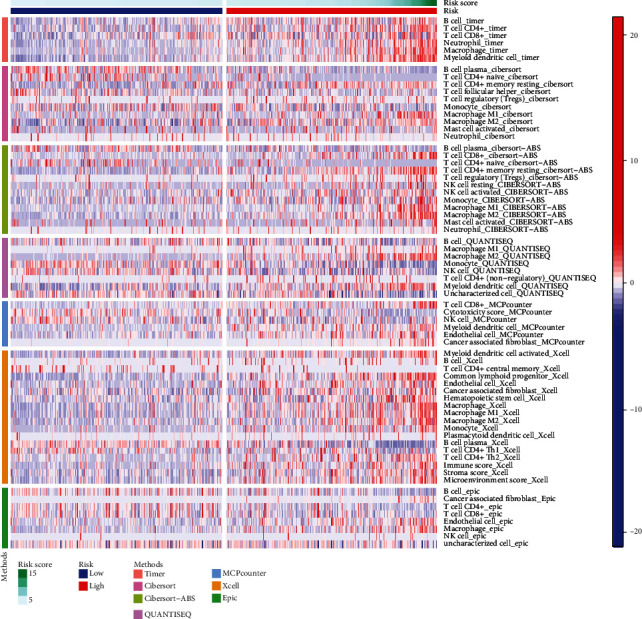
Figure 10.

A heat map of immunological responses between high- and low-risk groups using the CIBERSORT, ESTIMATE, MCP counter, ssGSEA, and TIMER algorithms.

A heat map of immunological responses between high- and low-risk groups using the CIBERSORT, ESTIMATE, MCP counter, ssGSEA, and TIMER algorithms.