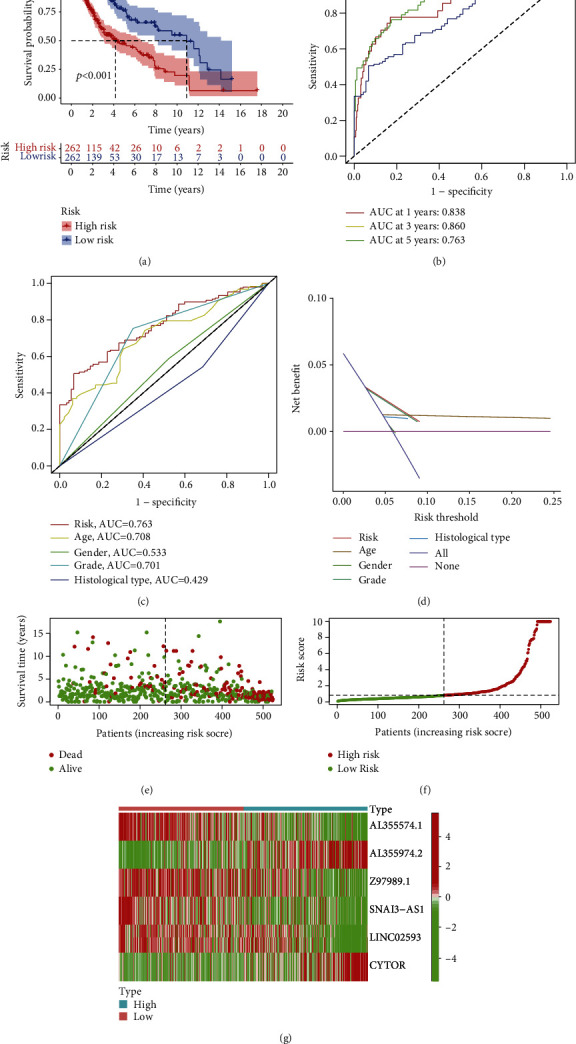
Figure 2.

TCGA-based signature for pyroptosis-related lncRNAs. (a) The outcome of the Kaplan-Meier curves. (b) AUC values for predicting LGG survival rates at 1, 3, and 5 years. (c) The area under the curve (AUC) values of the risk variables. (d) The risk factors' DCA. (e) Plot of risk survival status. (f) The distribution of patient risk ratings. (g) Pyroptosis-related lncRNAs heat map in high- and low-risk groups.
