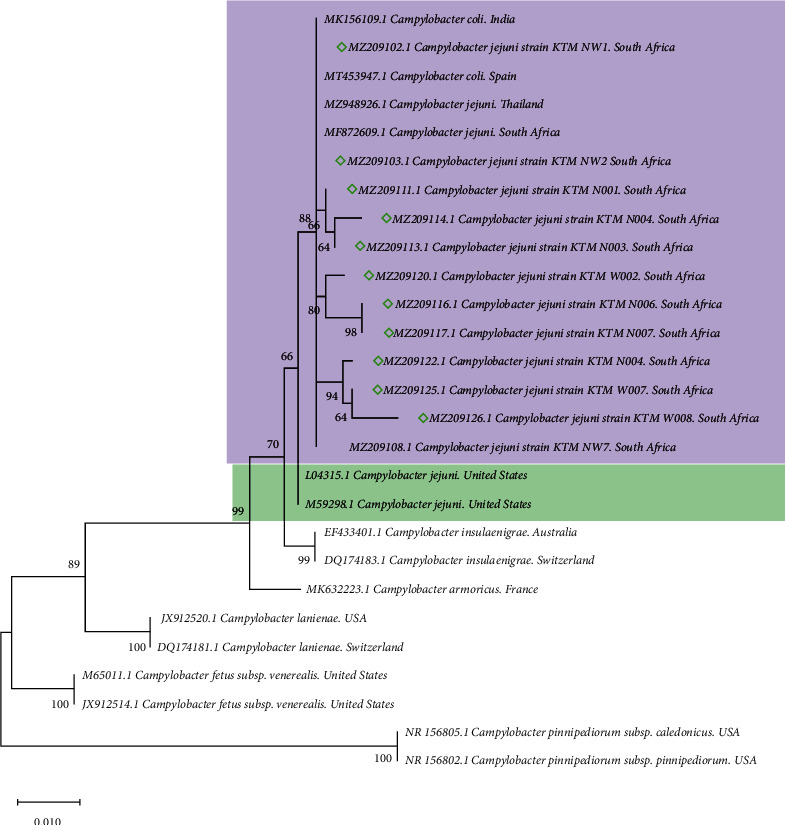
Figure 2.

Phylogenetic tree of the 16S rRNA gene constructed by using the maximum likelihood method and Kimura 2-parameter model among Campylobacter species. The node numbers represent the levels of bootstrap support based on 1000 replicates. The scale bar represents 0.010 substitutions per nucleotide position. All positions containing gaps and missing data were eliminated from the dataset (complete deletion option). The diamonds indicate C. jejuni isolates of the current study.
