
Figure 2.
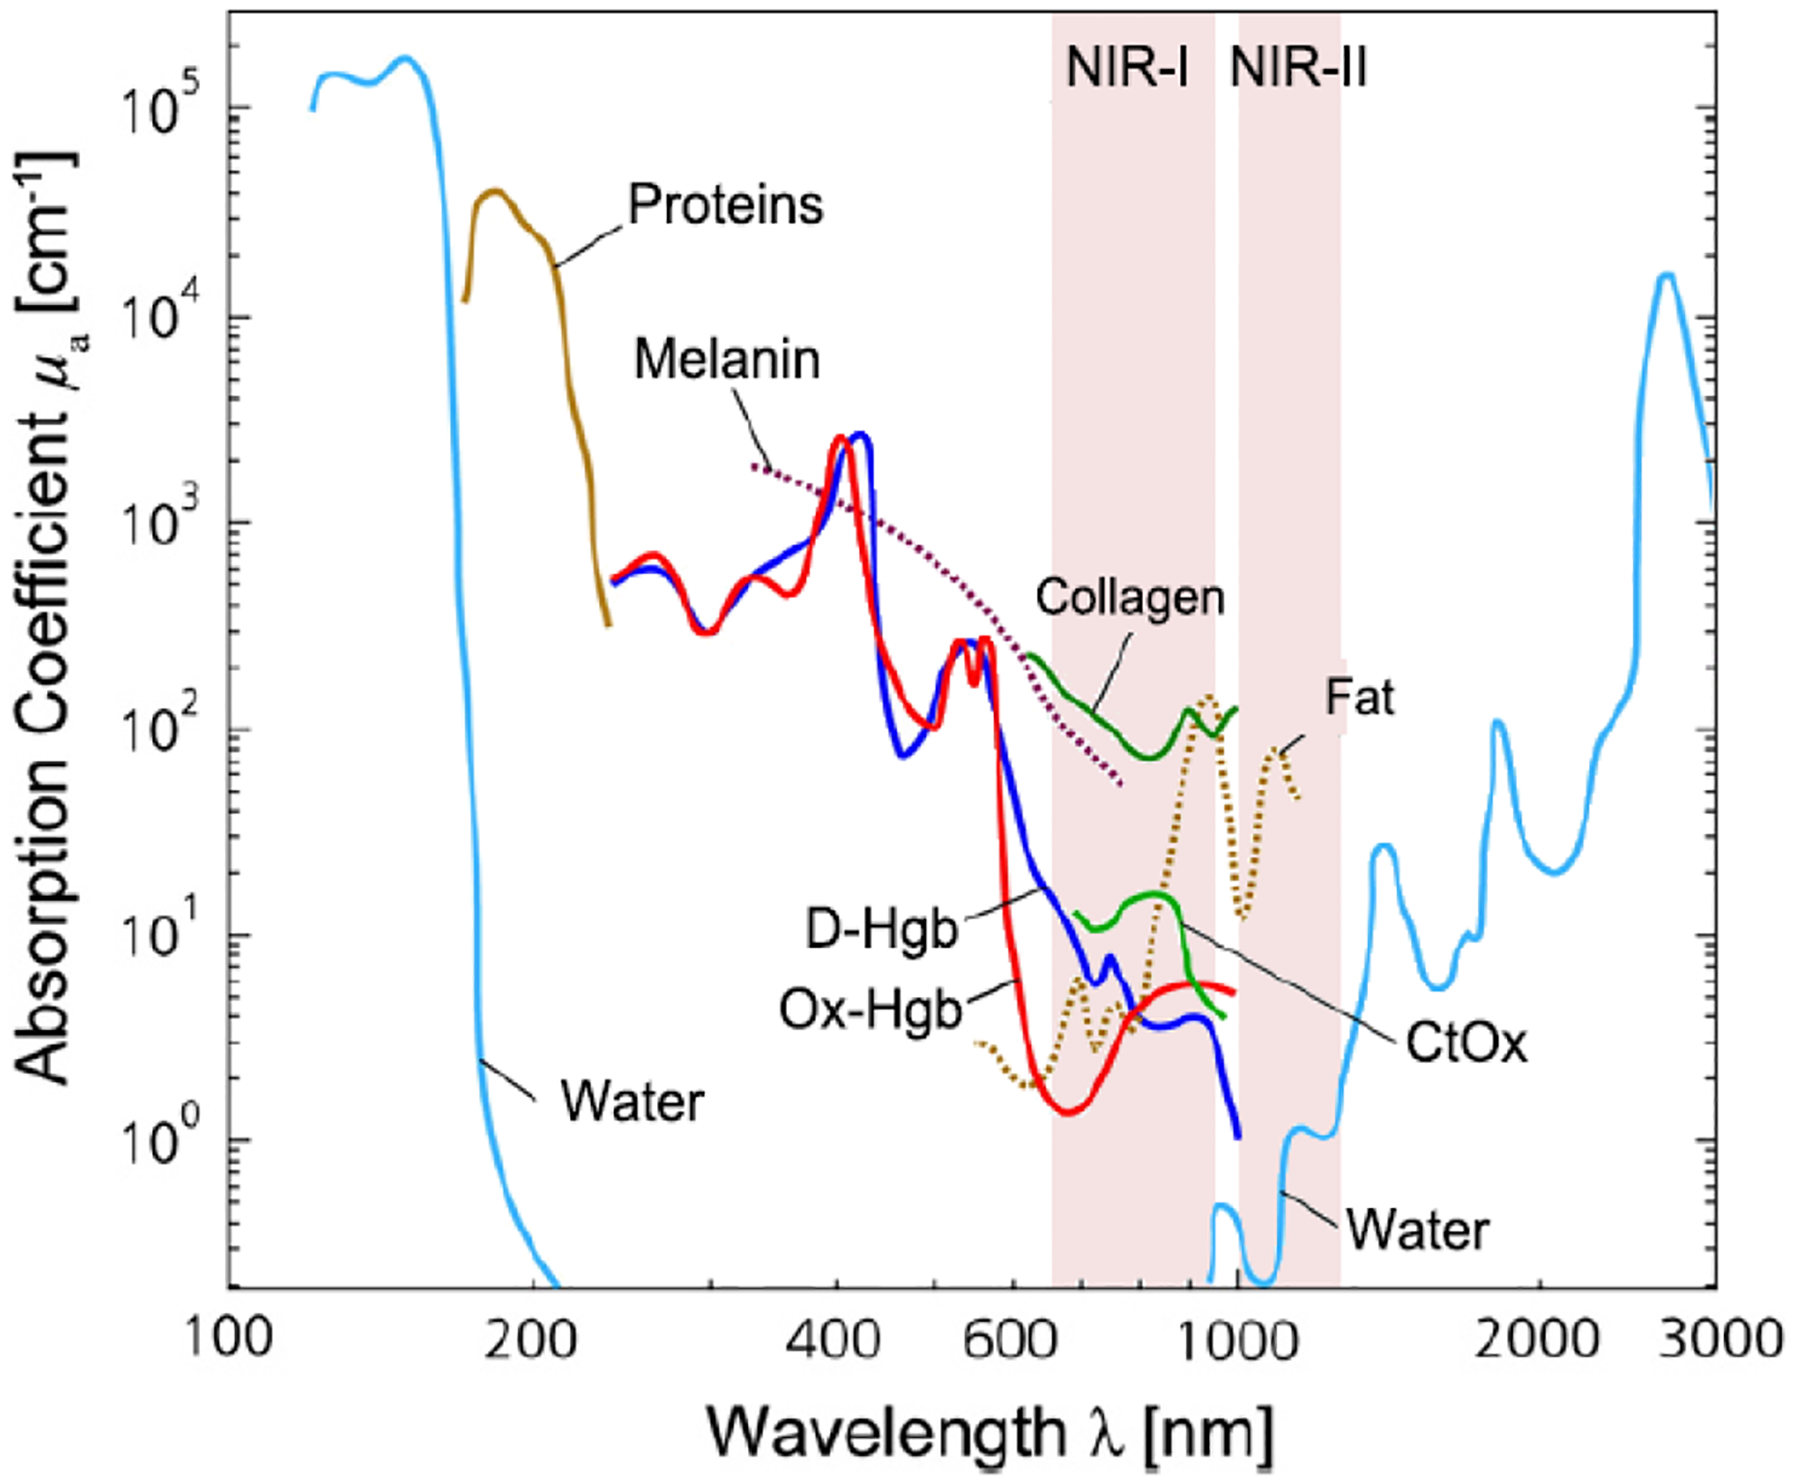
Light absorption spectra with X-axis on the natural logarithm base for different chromophores present in human tissues. The shown are the spectra for oxy-hemoglobin (Ox-Hgb) and deoxy-hemoglobin (D-Hgb), proteins, water, collagen, fat and cytochrome oxidase (CtOx) in the region from 100 nm to 3000 nm with respect to the specific concentration in mM. This figure is further modified from Ref 20, copyright 2014, Elsevier.