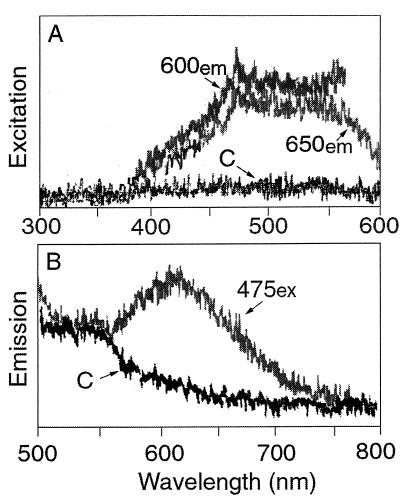
FIG. 1.
Fluorescence excitation (ex) and emission (em) spectra of CTC-positive bacteria. For the excitation spectra (A) emission was measured at 600 and 650 nm. For the emission spectrum (B) excitation was measured at 475 nm. The control spectra (spectra C) are spectra obtained for a bacterial culture to which CTC was added after the cells were killed with formalin; these spectra were the same as the spectra obtained for formalin-fixed bacteria alone.

