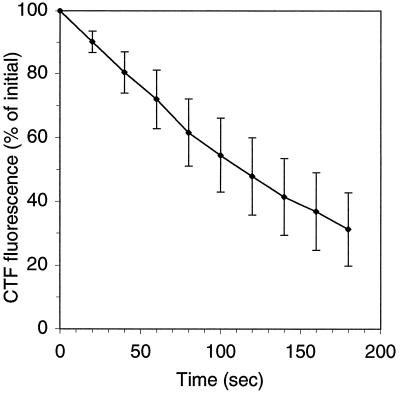
FIG. 2.
Loss of CTF fluorescence by individual cells in a microscope field when they were continuously exposed to blue excitation illumination from an Hg lamp. The mean fluorescence data for 73 cells are shown. The error bars indicate one standard deviation. The initial fluorescence values varied more than 10-fold (range, 900 to 11,000 RFU).

