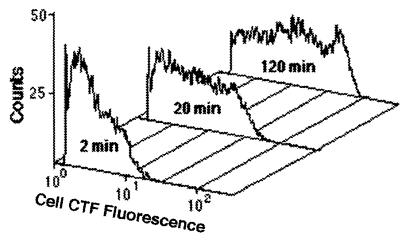
FIG. 8.
Representative activity histograms for three samples obtained from the unenriched, static preparation in the bubble experiment. While the mean and maximum CTF fluorescence values per cell clearly increased with time of exposure to CTC, the positive population never separated from the baseline, suggesting that there was a continuum of activity which extended to below the detection levels.

