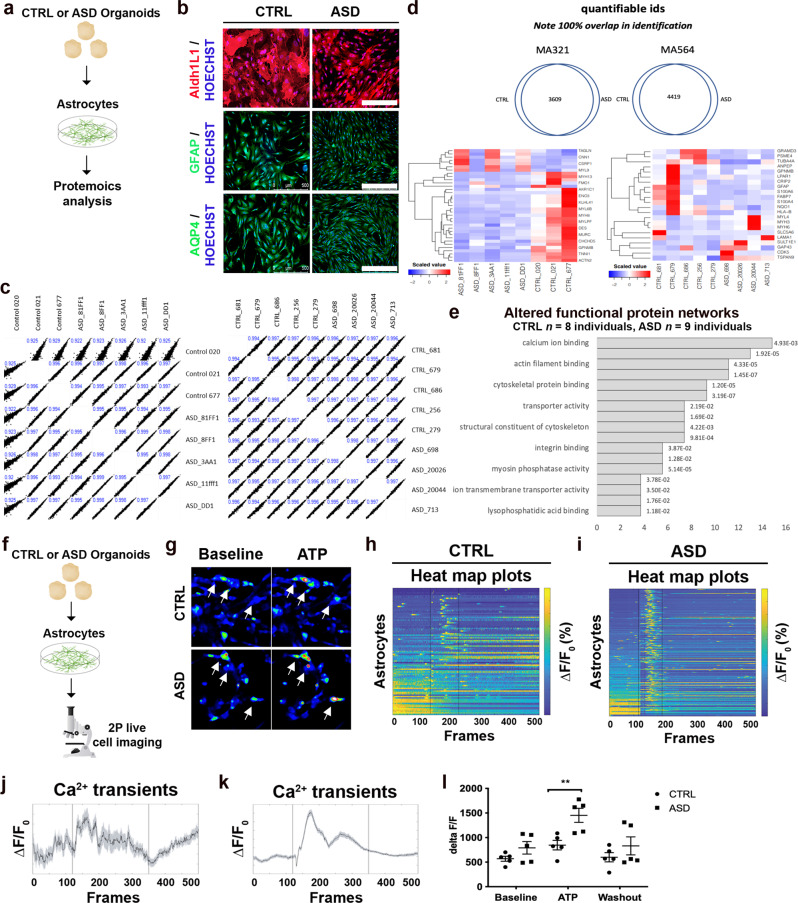
Fig. 1. Aberrant Ca2+ activity in ASD astrocytes.
a, b Spontaneous generation of human astrocytes. a Astrocytes were dissociated from ASD or CTRL organoids at day 75 and expanded in culture (see “Methods” section). b Representative images from immunostainings shows that astrocytes dissociated from organoids expressed multiple astrocyte markers: ALDH1L1, GFAP, and AQP4 as well as Vimentin and S100Beta (see also Supplementary Fig. 1b–d). c–e Proteomic study identified Ca2+ signaling as the most significantly altered network in ASD astrocytes. Proteins were extracted from astrocytes and labeled with Tandem Mass Tag (TMT) chemistry followed by LC/MS analysis. c Two independent proteomic runs and analyses, of which each exhibited high experimental reproducibility. d Venn diagrams for both runs revealed 3609 and 4419 proteins, respectively, which were common to both CTRL and ASD astrocyte samples. e GO analysis revealed enrichment for Ca2+ ion binding proteins in ASD samples. f–i Increased Ca2+ activity in ASD astrocytes. f CTRL or ASD astrocytes were loaded with Ca2+ indicator dye (Fluo-4-am, 1 μM). Data are shown as the change in fluorescent activity divided by baseline fluorescent activity (ΔF/F0). g Representative still images taken from the imaging videos highlighted fluorescent activity under baseline conditions (left) and after application of 50 μM ATP (right). Arrows point to cells that expressed Ca2+ transients under baseline conditions (left) and after stimulation with ATP (50 μM). ASD astrocytes responded to stimulation with more intense transients as evidenced by increased fluorescence (hotter color) (see also Supplementary Video 1). Representative heat maps of Ca2+ responses from CTRL (h) or ASD (i) astrocytes across time visually confirmed enhanced evoked responses from ASD astrocytes (application of ATP occurred within black vertical lines). Evoked responses (ΔF/F0) from all CTRL (j) and ASD (k) recordings, sampled over multiple days of recording and from multiple ASD lines, were plotted as a function of time (frames). l Quantification of the maximal peak amplitude of Ca2+ upon application of ATP showed that, when compared to CTRL astrocytes, ASD astrocytes exhibited increased Ca2+ activity in response to ATP. In summary, two independent experiments confirmed that ASD astrocytes harbor dysfunctional Ca2+ signaling. Scale bar = 500 μm. Data are represented as mean ± SEM. Proteomics analysis: CTRL n = 8 lines; ASD n = 9 lines. Two-photon Ca2+ imaging: CTRL n = 865 cells from five lines; ASD n = 847 cells from five lines.

