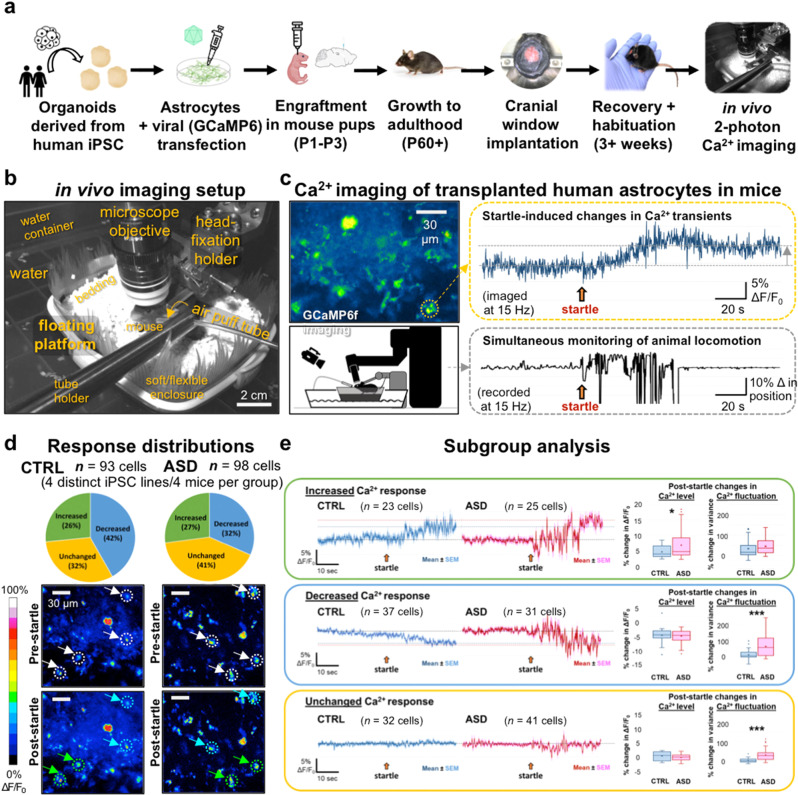
Fig. 3. In vivo imaging confirms aberrant Ca2+ activity in ASD astrocytes.
a Schematic of experimental workflow. b In vivo imaging setup. Photograph with labeled components of our custom-designed floating platform, developed to provide a tactile virtual-reality environment for head-fixed mice and to enable imaging of actively locomoting animals with minimal motion confounds (see “Methods” for details). c Ca2+ imaging of transplanted human astrocytes in mice. Left, upper panel: a representative image of GCaMP6f-expressing human astrocytes in the cortex of a mouse engrafted with cells derived from a CTRL human subject. Right, upper panel (orange box): Ca2+ transient recorded from the cell marked by the orange circle on the left image, showing an increase in Ca2+ level after the startle/air-puff stimulus (orange arrow). Left bottom panel: schematic of the imaging setup. The mouse is situated at the center on top of an enclosed platform (boat) floating on water (see “Methods” for details). Right bottom panel (gray box): representative trace of recorded locomotion during imaging, produced by analyzing the infrared video recording and plotting the light intensity change of a select ROI (region of interest) on the floating platform. As animal movement directly translated into platform displacement, any body motion generated by the animal could be tracked with accuracy and high temporal resolution, even heavy breathing could be seen indicated by the brief ticks at the latter part of the recording. d Response distributions. Transplanted human astrocytes displayed a variety of Ca2+ activity responses in vivo in reaction to the air-puff startle stimulus, including increased, decreased, and unchanged Ca2+ levels. We segmented the cells with a 20-μm-diameter mask, which encompassed both soma and processes. Top: pie charts showing the percent distribution of each response types in CTRL and ASD astrocytes. Bottom: representative images of CTRL and ASD astrocytes before and after startle. White circles and arrows (upper panels) point to sample cells showing post-startle increased (green arrows/circles) and decreased (blue arrows/circles) Ca2+ responses. e Subgroup analysis. For all traces, the mean ± SEM are plotted, representing the population average. Top (green box): increased response (cells displaying a positive change in ΔF/F after startle). Box plots showing ASD cells exhibit a significantly larger increase than CTRL cells (post-startle % change in ΔF/F: CTRL: +4.66 ± 0.384%, n = 23; ASD: +6.81 ± 0.937%, n = 25; unpaired t-test, p = 0.04). No significant differences are found in the changes in fluctuation between CTRL and ASD cells. Middle (blue box): decreased Ca2+ response subgroup (cells showing negative change in ΔF/F after startle). Both CTRL and ASD show decreases in Ca2+ to similar levels (~ −5%). However, there is a drastic difference in their change in Ca2+ fluctuations. Compare the flat downward sloping blue trace vs. the red trace with the dramatic fluctuation after startle. The box plots quantitatively illustrate this difference (Post-startle change in Ca2+ fluctuation: CTRL: 7.08 ± 4.74%, n = 37; ASD: 60.74 ± 11.04%, n = 31; unpaired t-test, p = 0.000062). Bottom (orange box): unchanged Ca2+ response subgroup (cells whose changes in Ca2+ levels are between +2 and −2%). While CTRL cells in this group show a completely flat and unresponsive activity profile, the ASD cells with unchanged Ca2+ levels showed a highly significant change in Ca2+ fluctuation (30% increase in variance) (Post-startle change in Ca2+ fluctuation: CTRL: 1.39 ± 2.08%, n = 32; ASD: 30.75 ± 4.63%, n = 41, unpaired t-test, p = 0.00000036).

