
Supplementary Fig.2. Interrupted time series analysis for ACS cases/week in elderly and young subpopulations.
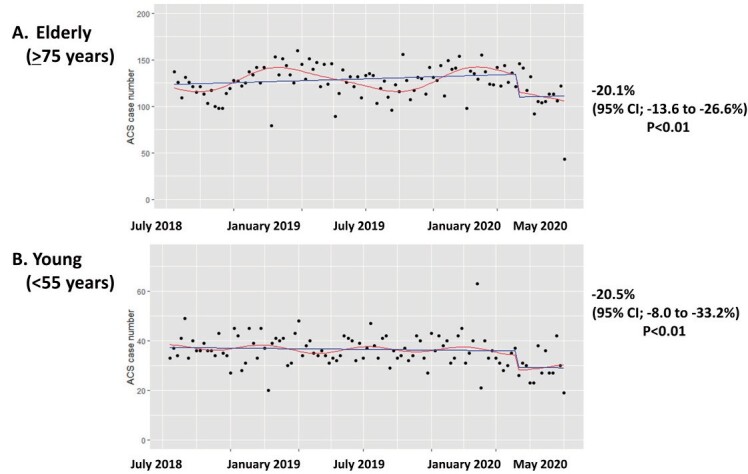
Red line; fitted curve, blue line; linear fitted value.
ACS; acute coronary syndrome.
Official websites use .gov
A
.gov website belongs to an official
government organization in the United States.
Secure .gov websites use HTTPS
A lock (
) or https:// means you've safely
connected to the .gov website. Share sensitive
information only on official, secure websites.
Red line; fitted curve, blue line; linear fitted value.
ACS; acute coronary syndrome.