
Supplementary Fig.1. Choropleth are maps for COVID-19 infections and deaths in Japan.
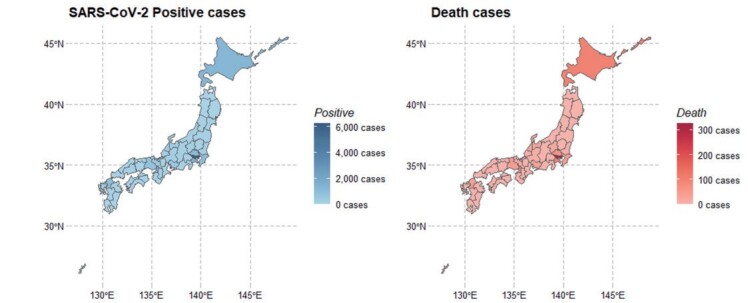
(Left) Geographic distribution of SARS-CoV-2 positive cases for during the initial phase of the epidemic in Japan
(Right) Geographic distribution of COVID-19 deaths in Japan.
High prevalence of confirmed SARS-CoV-2-positive cases and deaths were noted in areas of Tokyo, Hokkaido, Saitama, Chiba, Osaka, Hyogo, and Fukuoka.
SARS-Cov-2; severe acute respiratory syndrome coronavirus 2, COVID-19; coronavirus disease 2019