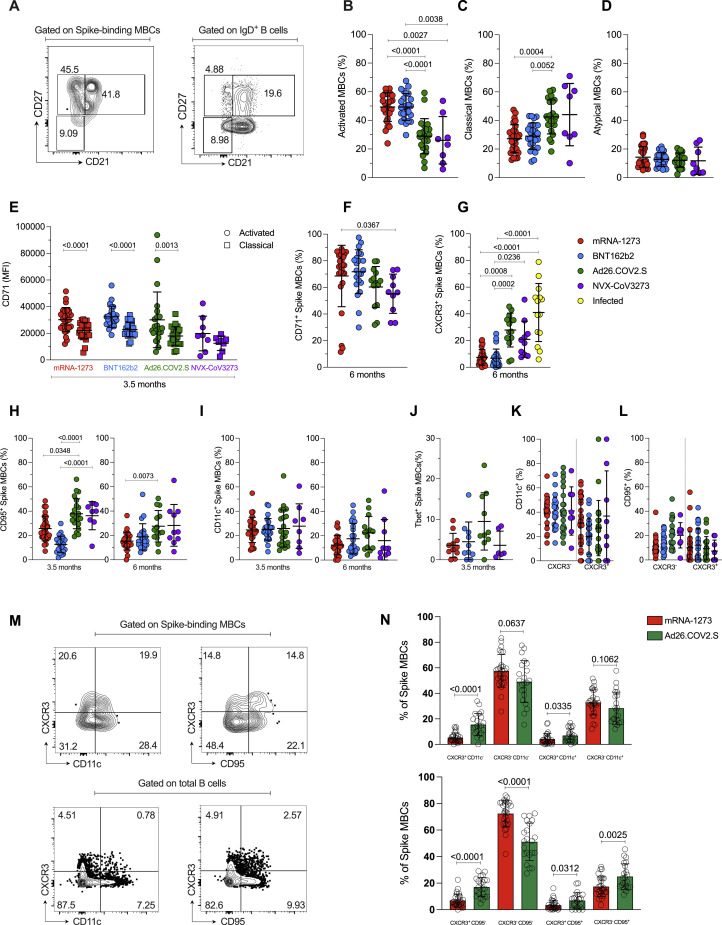
Figure S6.
Phenotypic characterization of SARS-CoV-2-specific MBCs elicited by COVID-19 vaccines. Related to Figure 6
(A) Representative gating strategy of spike MBCs with a classical (CD21+CD27+), activated (CD21−CD27+) and atypical (CD21−CD27−) phenotype. Control gating on IgD+ B cells is shown for comparison.
(B-D) Freq. of (B) activated (CD21−CD27+), (C) classical (CD21+CD27+) and (D) atypical (CD21− CD27−) spike MBCs at 3.5 months.
(E) CD71 expression by activated and classical spike-binding MBCs, at 3.5 months.
(F-G) Frequency of (F) CD71+ and (G) CXCR3+ spike-binding MBCs, at 6 months.
(H) Frequency of CD95+ cells among spike MBCs at 3.5 (left) and 6 (right) months.
(I) Frequency of CD11c+ cells among spike MBCs at 3.5 (left) and 6 (right) months.
(J) Frequency of Tbet+ cells among spike MBCs at 3.5 months.
(K-L) Frequency of CD11c+ or CD95+ cells among CXCR3+ or CXCR3- spike MBCs at 3.5 months.
(M) Representative gating to evaluate co-expression of CXCR3 and CD95 or CD11c.
(N) Example of co-expression of CXCR3 and CD95 or CD11c in response to mRNA-1273 or Ad26.COV2.S vaccines.
Data were analyzed for statistical significance using Kruskal-Wallis (KW) test [(B), (C), (D), (E), (F), (G), (H), (I), (J), (K), (L)], Mann-Whitney test [(N)], Wilcoxon matched-pairs signed rank test [(E)]. Data are represented as mean ± SD.

