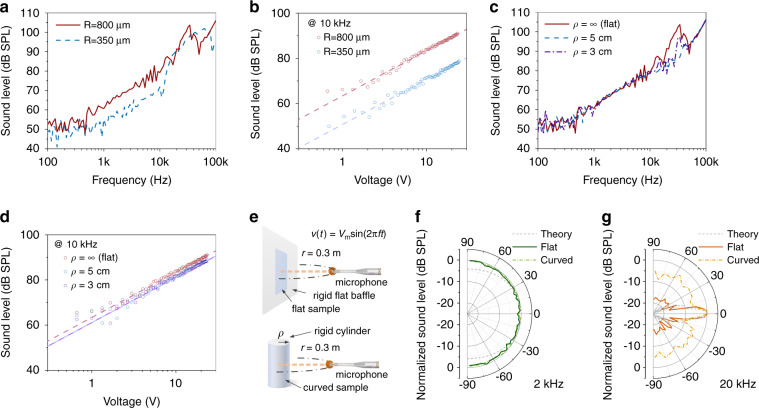
Fig. 4. Sound generation characteristics of the acoustically active surface.
a Frequency responses of representative acoustic surfaces. Two 10 cm × 10 cm samples (active area: 9 cm × 9 cm) with the same film thickness of 12 μm but different dome radii are compared in the figure. The sound pressure level is measured at a distance of 30 cm and a constant 10 V amplitude of the applied sinusoidal driving voltage. The pitches of the microdome array for the 350-μm-radius (R = 350 μm) sample and the 800-μm-radius (R = 800 μm) sample are 1 and 2 mm, respectively. b Sound pressure levels produced by the samples in response to varying drive voltages (RMS) at f = 10 kHz. c Frequency responses of an acoustic surface fixed on a rigid flat baffle or curved cylinders of different radii ρ under the same test conditions as (a). The dome radius is R = 800 μm, and the pitch is 2 mm. d Sound pressure level produced by the sample fixed on different surfaces in response to varying drive voltage (RMS) at f = 10 kHz. e Schematic showing the measurement of the directivity patterns of an acoustic surface mounted on a rigid flat baffle and an acoustic surface mounted on a rigid cylinder. f, g Directivity patterns of a representative acoustic surface (active area: 9 cm × 9 cm) on a rigid baffle (solid curves) and a representative acoustic surface (active area: 9 cm × 9 cm) on a glass cylinder of radius ρ = 5 cm (dotted-dashed curves) at f = 2 kHz (f) and f = 20 kHz (g), respectively, in terms of normalized SPL. The SPL at different angles to the acoustic surface is measured while maintaining a constant distance of 30 cm and normalized based on the maximum value in space. The dashed curves provide the theoretical directivities of a flat acoustic surface at 2 and 20 kHz, predicted based on the Rayleigh integral.

