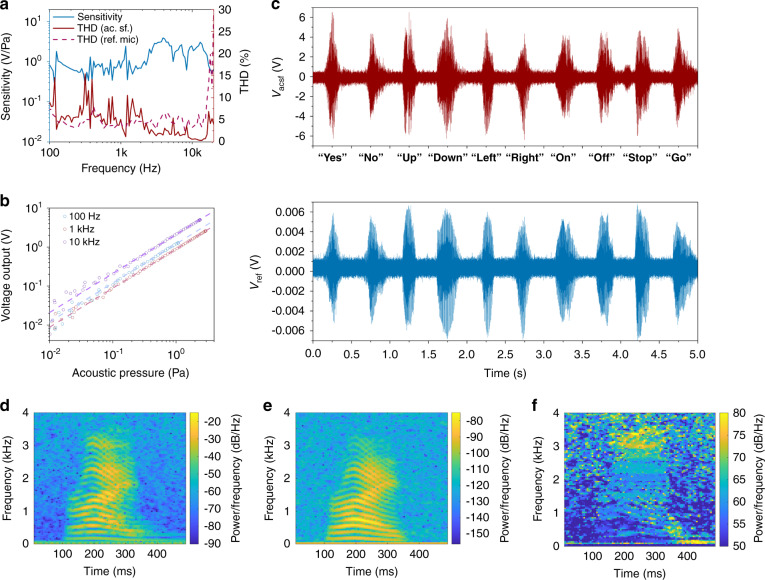
Fig. 5. Microphonic performance of the acoustically active surface.
a Sensitivity and THD of the acoustic surface. The THD corresponding to the reference microphone is provided as a dashed curve in the figure for comparison. A 10 cm × 10 cm sample with microdomes of radius R = 350 μm and thickness h = 12 μm is utilized. b Voltage output of the acoustic surface as a function of incident acoustic pressure. The output signal from the acoustic surface is amplified by a transimpedance amplifier with a 108 V/A gain. c Comparison between the waveforms of a series of voice commands recorded by the acoustic surface and those recorded by the reference microphone. d Spectrogram of the waveform of voice command “RIGHT” recorded by the acoustic surface. e Spectrogram of the waveform of voice command “RIGHT” recorded by the reference microphone. f Spectrogram of the waveform recorded by the acoustic surface normalized by that recorded by the reference microphone. The voice waveforms are recorded with a 200 kS/s sampling rate. The spectrograms are plotted with a window of 5000 samples and an overlap of 4000 samples between adjoining sections. Spectrograms from another example can be found in Fig. S5.

