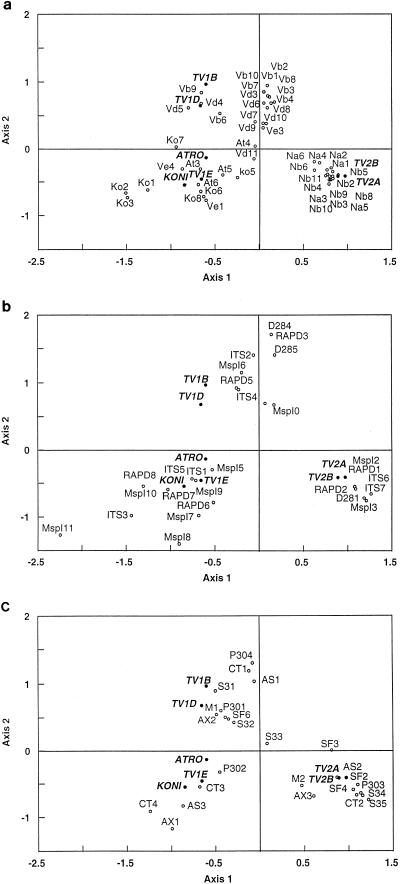
FIG. 2.
Discrimination of T. viride taxa by simple CA. (a) Graph of all 47 isolates and the ideal species supplemented after the analysis; (b) graph of important molecular characteristics and ideal species; (c) graph of important morphological characteristics of the anamorphs and ideal species. The scales of the two axes in all panels are the same, and the black dots of the ideal species are added to provide orientation.

