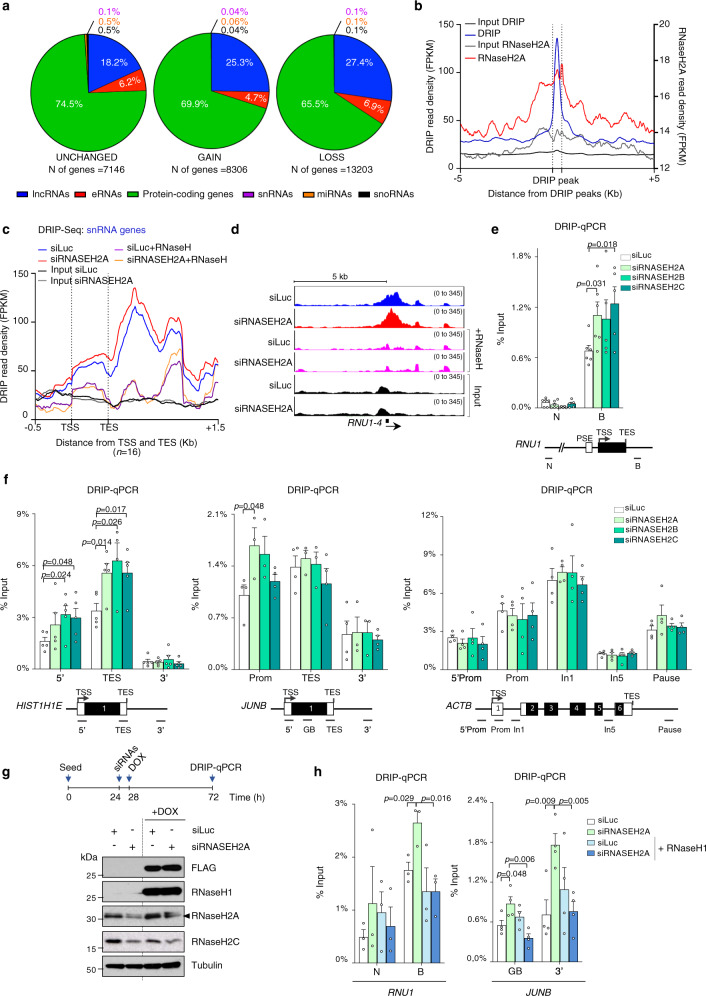
Fig. 4. RNase H2 depletion induces R-loop accumulation.
a Distribution of genes in the indicated genic compartments defined by DRIP-seq peaks in control and RNase H2A-depleted HeLa cells. Unchanged (left), increased/gained (middle) and decreased/lost (right) peaks in RNase H2A-depleted HeLa cells are shown. b Meta-analysis of DRIP-seq peaks (blue) enriched over both input and RNase H-treated control in siLuc samples (+/−250 bp around peak center). RNase H2A ChIP-seq data (red) are superimposed on DRIP peaks (+/−5 kb). c Meta-analysis of DRIP-seq on snRNA genes following RNase H2A depletion in HeLa cells with the window size of the presented plot adjusted to the gene size. siLuc (blue) and siRNASEH2A (red) tracks show an average signal of two replicates. RNase H-treated samples correspond to one replicate and are shown in orange and purple. d DRIP-seq profiles of RNU1-4 in HeLa cells treated as in c. e, f DRIP-qPCR for the indicated genes in HeLa cells following RNase H2A, H2B or H2C depletion (shades of green). Values are expressed as percentage of input (means ± SEM). p-values were calculated using two-tailed unpaired t-test. e snRNA RNU1 gene. n = 5 (siRNASEH2B and siRNASEH2C) and n = 6 (siLuc and siRNASEH2A) biologically independent experiments. f Histone HIST1H1E gene; n = 5 (n = 4 TES siRNASEH2B) biologically independent experiments (left panel). Intronless JUNB gene; n = 3 (siRNASEH2A and siRNASEH2B) and n = 4 (siLuc and siRNASEH2C) biologically independent experiments (middle panel). Intron-containing ACTB genes; n = 4 biologically independent experiments (right panel). Gene diagrams are shown on the bottom panel. g, h HEK293T RNase H1-FLAG-IRES-mCherry cells transfected with siLuc (white bars) or siRNASEH2A (green bars) and induced with doxycycline (+DOX) to over-express RNase H1 (shades of blue). g Schematic of the protocol (top panel), Western blot probed with the indicated antibodies (bottom panel). h DRIP-qPCR for the indicated genes. Values are expressed as percentage of input (means ± SEM); n = 3 (RNU1) and n = 4 (JUNB) biologically independent experiments. p-values were calculated using two-tailed unpaired t-test. Source data are provided as a Source data file.

