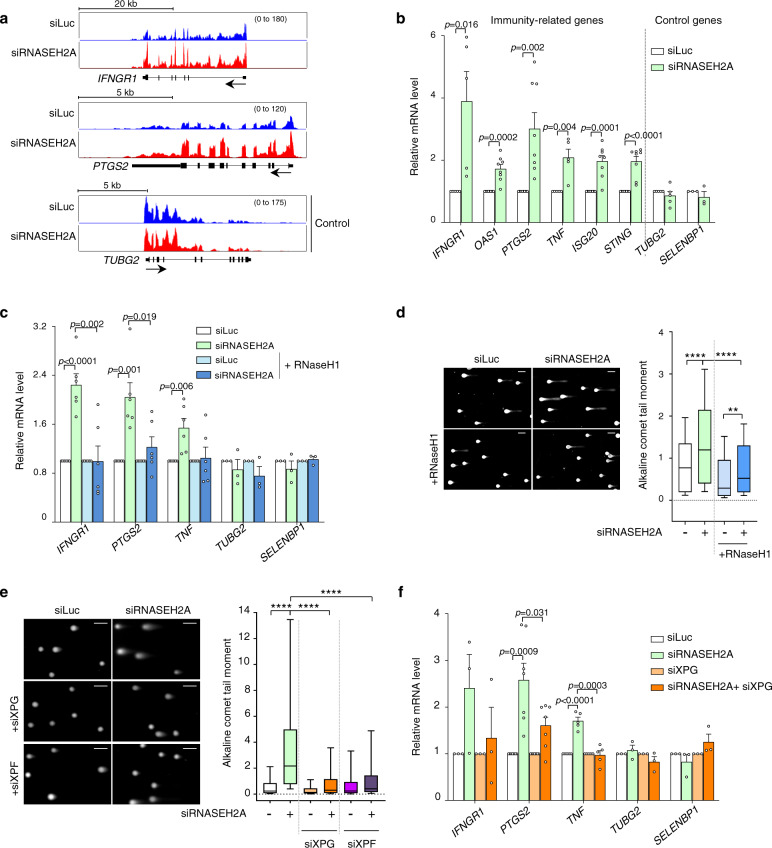
Fig. 5. R-loops contribute to activation of inflammatory response in RNase H2-depleted cells.
a ChrRNA-seq profiles for INFNGR1 (top), PTGS2 (middle) and TUBG2 (bottom) genes in HeLa cells transfected with siLuc (blue) and siRNASEH2A (red). TUBG2 is a control gene. Each track represents an average signal from two biologically independent experiments (n = 2). b qRT-PCR of indicated mRNAs in HeLa cells transfected with siLuc (white bars) or siRNASEH2A (green bars). Values are relative to siLuc cells (means ± SEM); n = 8 (OAS1, PTGS2, ISG20, STING), n = 5 (IFNGR1, TNF, TUBG2), n = 3 (SELENBP1) biologically independent experiments. p-values were calculated using two-tailed unpaired t-test. c HEK293T RNase H1-FLAG-IRES-mCherry cells transfected with siLuc (white bars) or siRNASEH2A (green bars) and induced with doxycycline (DOX) to over-express RNase H1 (shades of blue) as in Fig. 4g. qRT-PCR analysis of indicated mRNAs. Values are relative to siLuc or siLuc +DOX (means ± SEM); n = 6 (IFNGR1, PTGS2, TNF), n = 3 (TUBG2 and SELENBP1) biologically independent experiments. p-values were calculated using two-tailed unpaired t-test. d Alkaline comet assays in HEK293T RNase H1-FLAG-IRES-mCherry cells treated as in c. Representative images (left) and quantification of comet tail moment (right). Scale bars: 100 µm. Boxplot settings are: box: 25–75 percentile range; whiskers: 10–90 percentile range; horizontal bars: median; outliers not displayed. >500 nuclei were quantified per condition. Representative data from n = 4 biologically independent experiments. p-values: **p = 0.0065, ****p < 0.0001 (one-way ANOVA, Tukey’s multiple comparison test). e Alkaline comet assays in HeLa cells transfected with the indicated siRNAs (siXPG are in shades of orange, siXPF in shades of purple). Representative images (left) and quantification of comet tail moment (right). Scale bars: 100 µm. Boxplot settings are: box: 25–75 percentile range; whiskers: 10–90 percentile range; horizontal bars: median; outliers not displayed. Representative data from n = 3 biologically independent experiments. >400 nuclei were quantified per condition. ****p < 0.0001 (one-way ANOVA, Tukey’s multiple comparison test). f qRT-PCR analysis of indicated mRNAs (siRNASEH2A alone is in green, siXPG are in shades of orange). Some siRNA transfections were performed in parallel to siAQR and siXPF and have the same siLuc and siRNASEH2A controls as in Supplementary Figs. 7e and 8f. Values are relative to siLuc and siXPG cells (means ± SEM); n = 3 (IFNGR1, TUBG2, SELENBP1), n = 5 (TNF) and n = 7 (PTGS2) biologically independent experiments. p-values were calculated using two-tailed unpaired t-test. Source data are provided as a Source data file.

