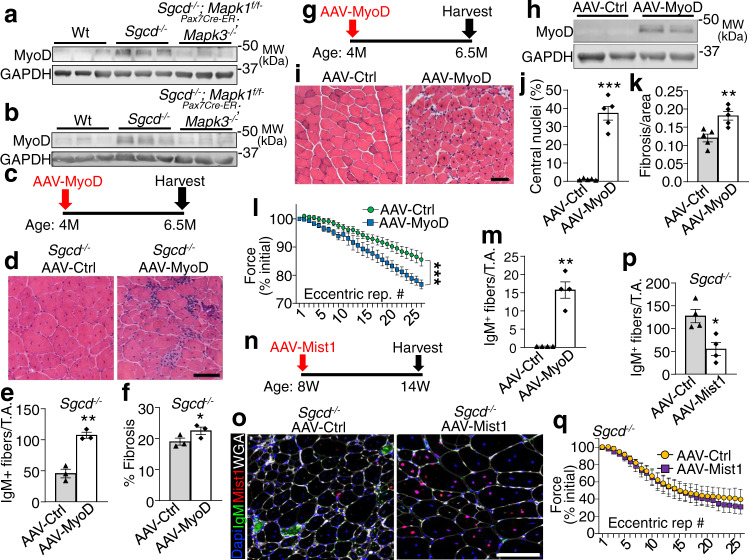
Fig. 4. Ectopic MyoD expression destabilizes the sarcolemma in vivo.
Western blotting for MyoD protein expression using Quad lysate from 2- or 4-month-old mice of indicated genotypes treated with Tmx starting at 2 (a) or 8 (b) weeks of age. GAPDH is shown as loading control. Results from three different mice are shown. c Schematic for AAV-MyoD or AAV-control injection into Sgcd−/− mice at 4 months of age, harvested by 6.5 months. d H&E-stained TA muscle histological sections from Sgcd−/− mice injected with the indicated recombinant virus. Scale bar = 100 μm. e IgM positive fibers quantified in TA muscle histological sections with prior AAV-MyoD or AAV-control infection in Sgcd−/− mice. n = 3 mice per group, **P < 0.01 vs AAV-Ctrl, two-tailed Student’s t test. f Picrosirius red-stained histological section of the TA muscle for quantitation of fibrosis in Sgcd−/− mice with prior AAV-MyoD or AAV-control infection. n = 3 mice per group, *P < 0.05 vs AAV-Ctrl, two-tailed Student’s t test. g Schematic of recombinant AAV treatment in Wt mice. h Western blot for MyoD from TA muscle of Wt mice 2.5 months after AAV injection. GAPDH was run as a loading control. Results from two different mice are shown. i H&E-stained TA muscle histological sections from Wt mice injected with the indicated recombinant virus. Scale bar = 100 μm. j Quantitation of myofiber number with central nucleation in H&E-stained histological sections from the TA muscle with prior AAV-MyoD or AAV-control infection in Wt mice. n = 5 mice per group, ***P < 0.001 vs AAV-Ctrl, two-tailed Student’s t test. k Quantitation of fibrosis in picrosirius red-stained histological sections from the TA muscle in Wt mice with prior AAV-MyoD or AAV-control infection. n = 5 mice per group, **P = < 0.01 vs AAV-Ctrl, two-tailed Student’s t test. l Percent change in force transduction for TA muscles subjected to continuous repetitive eccentric contractions in Wt mice injected previously with AAV-MyoD or AAV-Ctrl. The x-axis shows number of progressive repetitive (rep) contractions. A two-way repeated measures ANOVA was used to determine significance, n = 12 mice for AAV-Ctrl, n = 11 mice for AAV-MyoD, ***P < 0.001 for interaction. m IgM positive fibers quantified in TA muscle histological sections with prior AAV-MyoD or AAV-control injection in Wt mice. n = 4 mice per group, **P < 0.001 vs AAV-Ctrl, two-tailed Student’s t test. n Schematic of recombinant AAV-Mist1 vs AAV-Ctrl TA muscle injection in Sgcd−/− mice at the indicated times. o Immunohistochemistry from the TA muscle of Sgcd−/− mice injected prior with AAV-Mist1 or AAV-Ctrl, stained for IgM (green), Mist1 (red), Dapi for nuclei (blue) or myofiber outlines with wheatgerm agglutinin (white). Scale bar = 100 μm. p IgM positive fibers quantified in TA muscle histological sections of Sgcd−/− mice with prior AAV-Mist1 or AAV-control injection. mice. n = 4 mice per group, *P < 0.05 vs AAV-Ctrl, two-tailed Student’s t test. q Percent change in force transduction in the hindlimb subjected to continuous repetitive eccentric contractions in Sgcd−/− mice injected previously with AAV-Mist1 or AAV-Ctrl. The x-axis shows number of progressive repetitive (rep) contractions. n = 7 mice for AAV-Ctrl, n = 8 mice for AAV-Mist1. Data represent mean ± SEM for all graphs.

