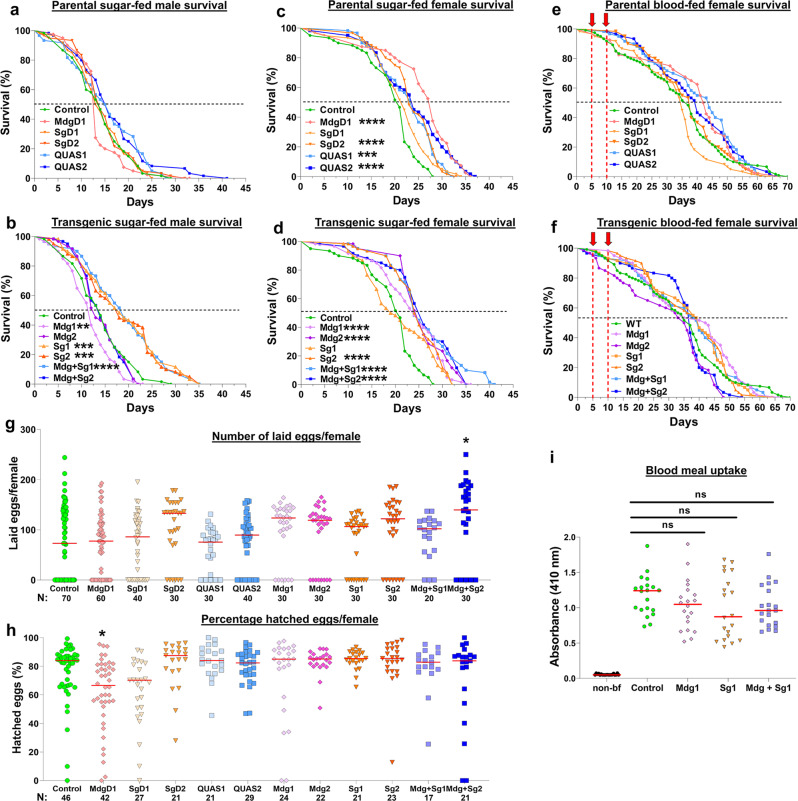
Fig. 3. Fitness analysis of An. stephensi transgenic lines.
a–d The survival rates for WT, parental and transgenic lines maintained on a sugar meal were evaluated for males (a, b) and females (c, d). e, f Survival was also evaluated for females that received two consecutive blood meals (red arrows). Survival rate was calculated by Kaplan–Meier survival curves, and multiple comparisons were done by two-sided Log-rank test with Bonferroni correction across all lines. b **P = 0.0080, ***P = 0.0001, ****P < 0.0001. c ***P = 0.0001, ****P < 0.0001. d ****P < 0.0001. N = 60 mosquitoes for each of three individual biological replicates. g, h Fecundity (number of laid eggs) (g) and fertility (proportion of the laid eggs that hatched) (h) of parental and huPAI-1 transgenic lines were evaluated from the same cohort of mosquitoes. Transgenics were compared to WT by Kruskal–Wallis multiple comparisons with Dunn’s post-test. *P = 0.0373. Data from at least three individual biological replicates, except for line Mdg + Sg1 which was tested in duplicate experiments (N = 10 females/replicate). i Blood uptake is not affected in transgenic mosquitoes expressing huPAI-1. Quantification of protein-bound heme at 410 nm from midguts of WT and transgenic mosquitoes before (non-bf) and after a blood meal. Horizontal red lines represent the median of data pooled from two independent experiments (N = 10 females/replicate). Statistical analysis was determined by Kruskal–Wallis multiple comparisons with Dunn’s post-test. ns not significant. N = 20 females per experiment.

