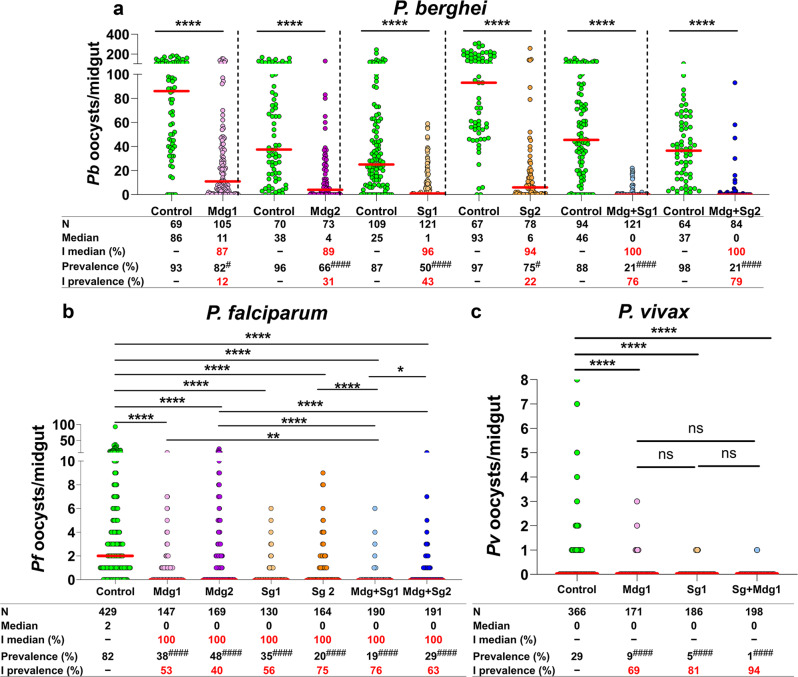
Fig. 4. huPAI-1 expression strongly inhibits P. berghei, P. falciparum, and P. vivax oocyst formation.
Oocyst numbers were determined in transgenic and control mosquitoes infected with P. berghei after feeding on infected mice (a), P. falciparum by standard membrane feeding assay (SMFA) (b), and P. vivax by direct feeding on infected monkeys (c). Control experiments were done with either WT mosquitoes or the parental lines SgD1, SgD2, or QUAS2 (Supplementary Data 1, Datasets 3–5). P. falciparum SMFAs were performed with gametocyte-infected RBCs supplemented with plasma. Horizontal red lines represent the median oocyst number of data pooled from at least three independent experiments shown in Supplementary Data 1, Datasets 3–5. Statistical analysis for oocyst numbers was done by two-tailed Mann–Whitney U test For P. berghei (a), and Kruskal–Wallis multiple comparisons with Dunn’s posttest for P. falciparum (b) and P. vivax (c), *P < 0.0477, **P < 0.0016, ****P < 0.0001. Statistical analysis for prevalence was done by Fisher’s exact test for P. berghei (#P < 0.05, ####P < 0.0001) or Chi-squared test for P. falciparum (χ2 = 350.4, d.f. = 6, ####P < 0.0001) and P. vivax (χ2 = 12.10, d.f. = 2, P = 0.0024). Individual comparisons for P. falciparum and P. vivax prevalence shown in tables (b, c): ####P < 0.0001. I % inhibition, N number of analyzed mosquitoes. The percentage inhibition of median and prevalence was calculated as follows: 100 × [(number of oocysts in the control − number of oocysts in the experimental)/(number of oocysts in the control)].

