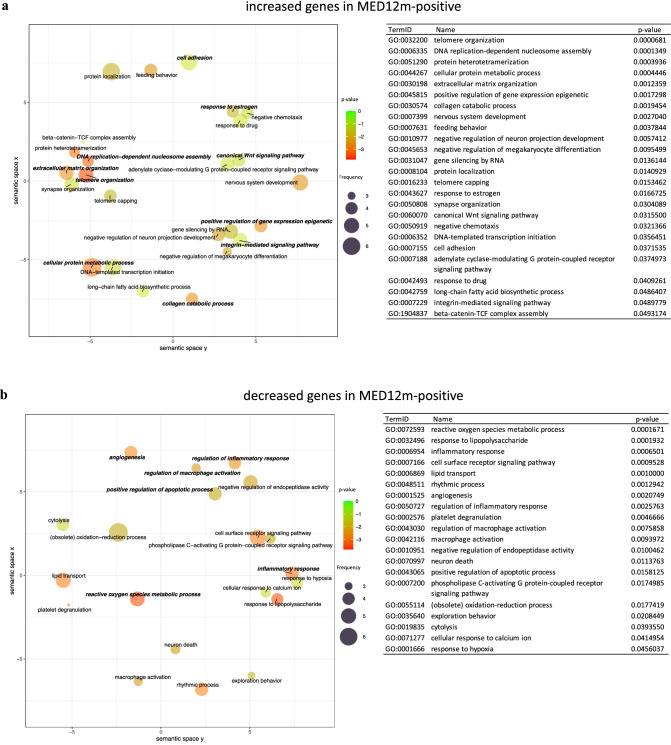
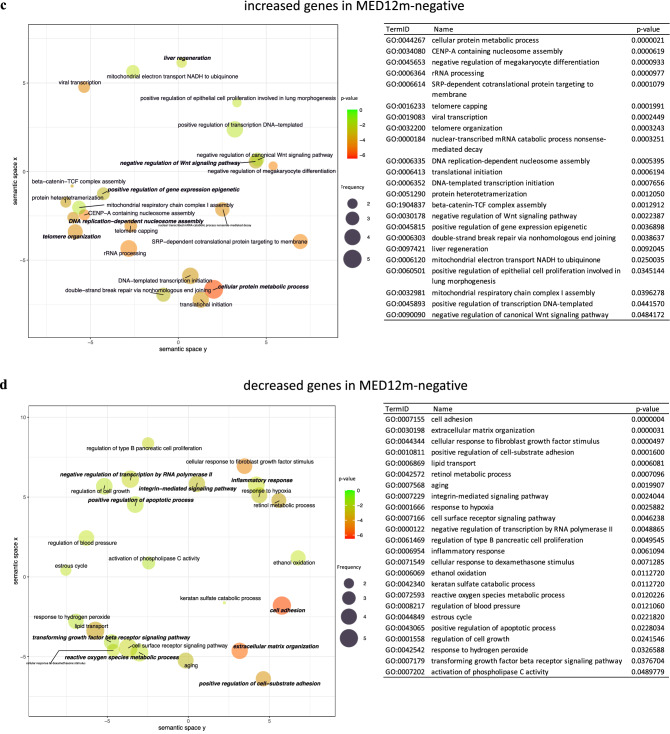
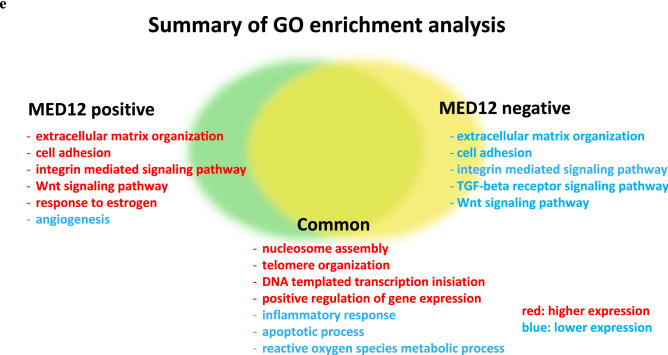
Figure 2.
The scatterplot of GO terms in DEGs. The plots and tables show the GO terms after the redundancy reduction in the MED12m-positive-increased (a), -decreased (b), the MED12m-negative-increased (c), and -decreased (d) DEGs. The colors indicate the log10(p-value) of the summarized GO terms. The size of the circle indicates the frequency of the GO term in the underlying GO database. The circles of more general terms are plotted larger. The color and the size of circles are plotted according to the default setting of REVIGO39. (e) Summary of GO analysis in the MED12m-positive and -negative uterine fibroids (drawn with Microsoft PowerPoint). The specific terms to the MED12m-positive uterine fibroids, the MED12m-negative uterine fibroids, and commonly detected terms are shown. Red and blue mean higher and lower expression compared to the myometrium.


