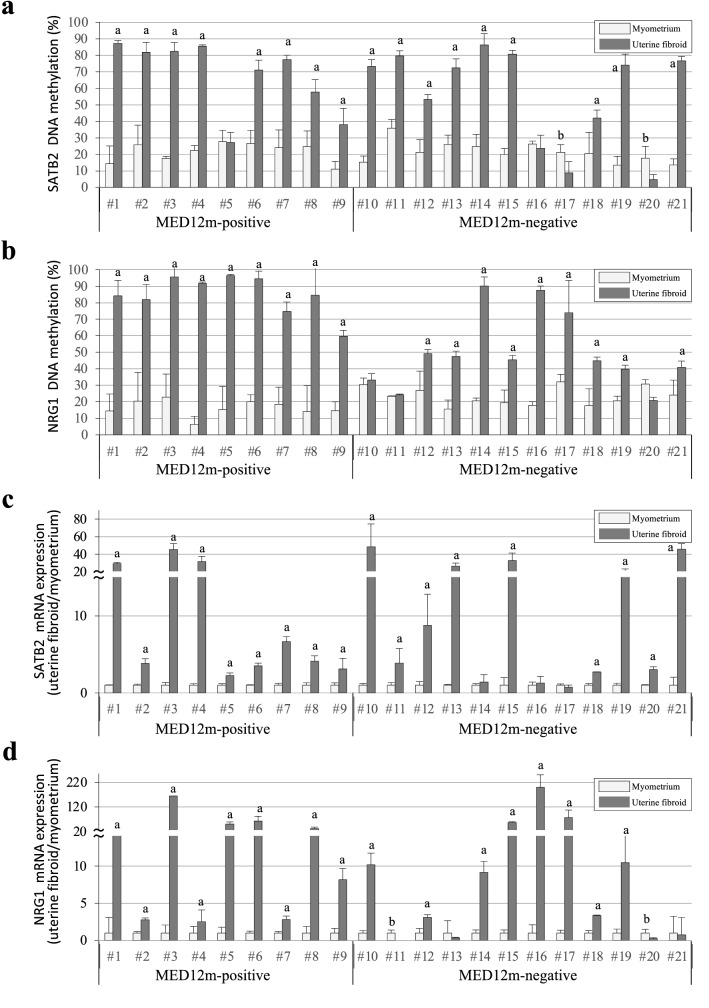
Figure 6.
DNA methylation and mRNA expression statuses of SATB2 and NRG1 genes. (a,b) The DNA methylation levels of SATB2 (a) and NRG1 (b) genes are shown in dot plots. The vertical axis indicates the DNA methylation levels in the MED12m-positive uterine fibroids (n = 9), -negative uterine fibroids (n = 12), and the corresponding myometrium. The DNA methylation levels were examined by COBRA and range from 0 to 100%. (c,d) The expression levels of SATB2 (c) and NRG1 (d) genes in the MED12m-positive uterine fibroids, -negative uterine fibroids, and the myometrium analyzed by qRT-PCR are shown in dot plots. The expression levels are corrected for myometrium expression as 1. ap < 0.01 (higher expression in uterine fibroids compared to myometrium, student t-test). bp < 0.01 (lower expression in uterine fibroids compared to myometrium, student t-test).

