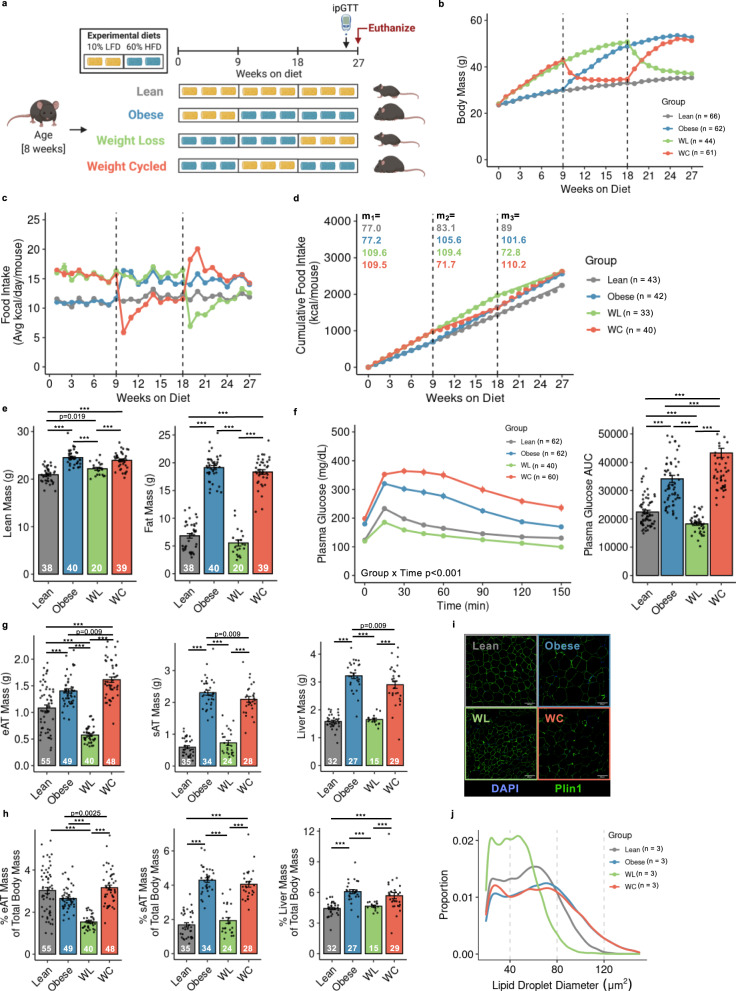
Fig. 1. Mouse models of lean, obese, weight loss (WL), and weight cycling (WC).
a Schematic of dietary approaches to generate WL and WC mice using 10% low fat diet (LFD) and 60% high fat diet (HFD). b Body mass over time measured weekly with diet switch indicated by dashed lines. c Food intake over time measured weekly. d Cumulative food intake measured throughout the duration of the studies with slope (m) for each 9-week segment indicated. e Lean and fat mass measured by nuclear magnetic resonance. f Blood glucose during an intraperitoneal glucose tolerance test (ipGTT) dosed at 1.5 g dextrose/kg lean mass one week prior to the end of the study and area under the curve (AUC) for ipGTT. g Tissue mass for epididymal adipose tissue (eAT), subcutaneous adipose tissue (sAT), and liver and h tissue mass as percentage of body mass at sacrifice. i Representative imaging of Perilipin-1 (Plin1) and 4′,6-diamidino-2-phenylindole (DAPI) immunofluorescence for lipid droplet size. (j) Distribution of lipid droplet size. For diet groups, gray = lean, blue = obese, green = WL, orange = WC. Pairwise two-tailed Student’s t-tests with Bonferroni correction for multiple comparisons were used to compare groups for body composition, tissue mass, and ipGTT AUC and two-way ANOVA was used to compare groups for ipGTT; significant p values shown or ***padj < 0.001. Data is plotted as mean ± SEM. Sample size (mouse per group; n) is indicated in corresponding figure legends or by white text at the bottom of each histogram. Figure 1a was created with Biorender.com.

