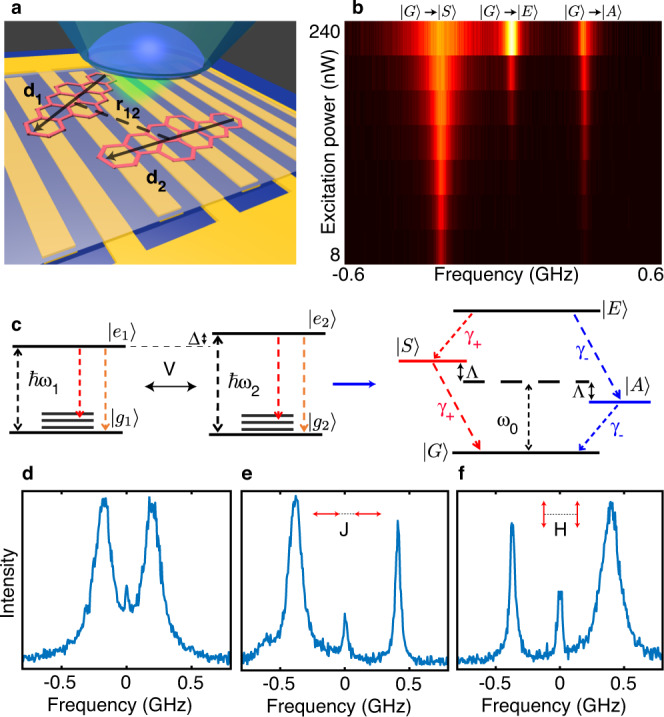
Fig. 1. Spectral signatures of coherently coupled pairs of molecules.

a Schematic of the sample. A highly doped naphthalene crystal doped with DBATT molecules is placed above a comb of micro-patterned gold electrodes (period of 20 μm) to apply electric fields up to few tens of MV m−1. A microscope objective with numerical aperture 0.95 is used to excite the molecules on their ZPLs and collect the red-shifted emitted photons. b Series of fluorescence excitation spectra recorded for a pair of coupled molecules at different excitation intensities ranging from 2 W cm−2 to 250 W cm−2. The onset of a two-photon transition |G〉 → |E〉 shows direct evidence of coherent dipole–dipole interaction. c Left: Energy levels of two bare molecules. Besides the purely electronic transition (orange arrows), the vibrational levels may be involved in the fluorescence process (red arrows) but do not participate to the coherent coupling due to fast relaxation to the ground electronic state (on the picosecond timescale). Right: The coupled molecules are treated as a four-level system with a ground state |G〉, a doubly excited state |E〉 and two split entangled states |A〉 and |S〉. d–f Excitation spectra of three different pairs of coupled molecules with various coupling strengths and dipole orientations. The symmetric state |S〉 is associated with in-phase dipoles. In the H-configuration, the electric field created by one dipole is parallel and in-phase opposition with the second dipole, so that the energy shift −d2.E1 (r2) of the |S〉 state is positive. In the J-configuration, the electric field is parallel and in phase with the dipole so that the energy shift of the |S〉 state is negative.
