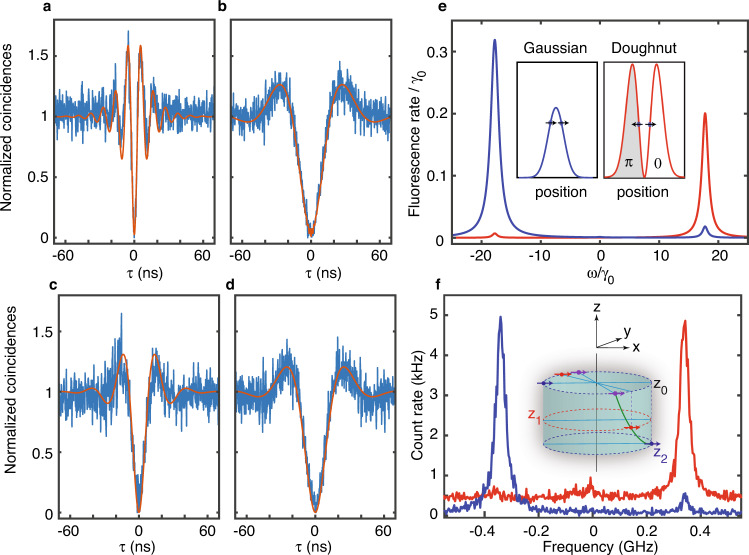
Fig. 4. Selective excitation of superradiant and subradiant states.
a, b Normalized photon coincidence histograms (after background subtraction) measured for a pair of coupled molecules excited with a Gaussian-shaped laser beam of intensity 200 W cm−2 at resonance with the |G〉 → |S〉 transition (a) and with the |G〉 → |A〉 transition (b) when the degree of superposition is maximized by Stark effect (PE ∼ 0.92, voltage 150 V). They are characterized by an antibunching dip and damped Rabi oscillations, while photon bunching is evidenced when the laser is resonant on the two-photon transition (Supplementary Fig. 10). The second-order correlation functions (red curves) are computed for nearly parallel dipoles in the J-configuration with V = −17γ0, γ12 = 0.3γ0, and Δ = 10γ0 (See Methods). c, d Photon coincidence histograms obtained for the same pair of coupled molecules when the molecular resonances are tuned apart by Stark effect (−150 V), leading to a modest degree of superposition PE ∼ 0.24. The excitation intensity is 40 W cm−2. The simulations are performed with the same parameters except for Δ = 60γ0. e, f Simulated (e) and experimental (f) spectra of the same pair excited with a Gaussian-shaped beam of 8 nW (blue curves) and a doughnut-shaped beam of 1 µW (red curves) centered midway between the molecules. The associated profiles of the laser field amplitude and phase are schematically displayed in the inset of (e). The simulations are performed with the above values of V, γ12, Δ, and with a = 0.8, b = 0.6. Depending on whether the emitters are excited in phase (Gaussian beam) or out of phase (doughnut beam), exclusive pumping of the superradiant or the superradiant state, respectively, is performed. The inset of (f) exemplifies three parallel-dipole configurations represented by blue, red, and purple couples of arrows, leading to the same coupling strength V and spectra (Supplementary Fig. 11). The positions of the dipoles may differ along the optical (z) axis, while their projections in the focal (x, y) plane are separated by 18 nm.

