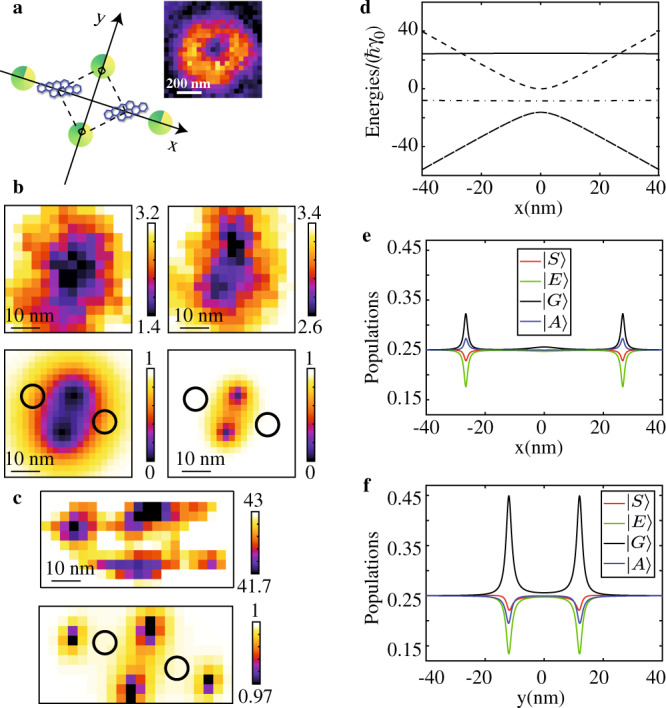
Fig. 5. Optical nanoscopy of molecules undergoing coherent optical dipole–dipole coupling.

a Configuration of the molecules in the focal plane (x,y). The green disks mark the four positions of the doughnut beam center leading to fluorescence dips. For the two positions marked along the y-axis, the phase difference between the laser fields felt by the two molecules is π/2. Inset: Fluorescence image recorded at weak saturations. b, c Experimental (top frames) and simulated ESSat (bottom frames) images of a pair of coupled molecules excited with a laser tuned on the two-photon transition, with increasing doughnut-peak intensities: 125 W cm−2, 500 W cm−2 (b), 5.4 × 10³ W cm−2 (c). The simulated ESSat images are computed with Δ = 0, V = −22γ0, γ12 = 0.5γ0 and intensities of 175 W cm−2, 700 W cm−2 (b), 7 × 10³ W cm−2 (c). The in-plane positions of the emitters, separated by (22 ± 5) nm, are marked with a circle. d Evolution of the four eigenenergies of H as the excitation beam is swept along the x-axis. e Evolution of the stationary populations of |G〉,|A〉, |S〉 and |E〉 along the x-axis. Each eigenstate experiences a position-dependent light shift and the fluorescence signal drops at the degeneracy points. Such coincidences are accompanied by a population increase for the |G〉 and |A〉. f Evolution of the stationary populations of |G〉, |A〉, |S〉 and |E〉 as the laser spot is swept along the y-axis. The peaks of |G〉 population occur at the two positions where .
