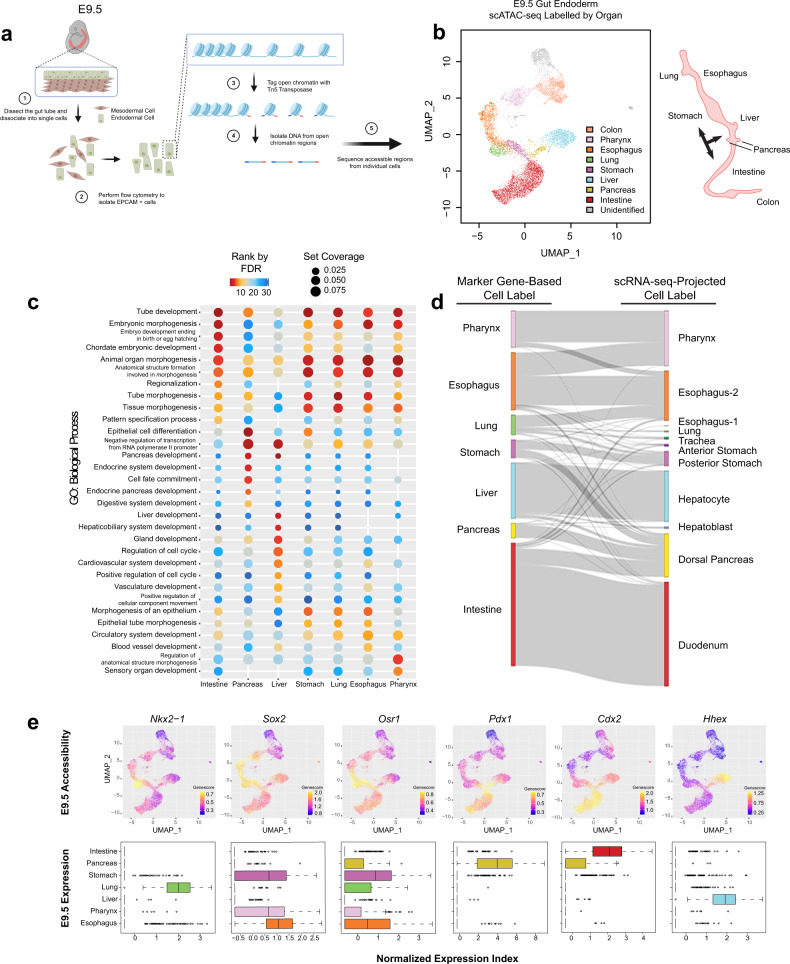
Fig. 1. Chromatin accessibility predicts organ fate and functions in conjunction with transcription in the primitive gut tube.
a Schematic diagram for the isolation of gut endodermal cells from E9.5 mice and scATAC-seq. b Single-cell scatter plot under UMAP dimensionality reduction demonstrating the clustering and organ assignment of cells. The organ assignment is conducted by comparing the gene score of known marker genes of organs. Each dot represents an individual cell and is colored by the assigned organ type. The spatial distribution pattern of organs on the UMAP resembles the actual anatomic positions of the organs on the right diagram. Black arrows label organ specification. c Organ-specific peaks for each organ cluster in (b) are assessed through a gene ontology of biological processes, with the top 10 processes of each organ displayed. GO terms are sorted in ascending order of their false discovery rate (FDR). Set coverage represents the fraction of all genes in the test set with the annotation. d Sankey diagram shows the relationship between marker gene-based organ labeling and scRNA-seq-projected organ labeling of cells from scATAC-seq data. e Known lineage-associated markers demonstrate organ-specific patterns of chromatin accessibility (top) and normalized expression (bottom). In UMAP scatter plots, cells are colored by gene score of the corresponding marker gene. In gene expression box plots (N = 9101, over 7 featured organs), the box centers represent median values, the lower and upper bounds of the boxes represent the first and third quantiles. The whiskers extend to the minimum and maximum values that do not exceed 1.5× IQR from the median values of the data (where IQR is the inter-quartile range).

