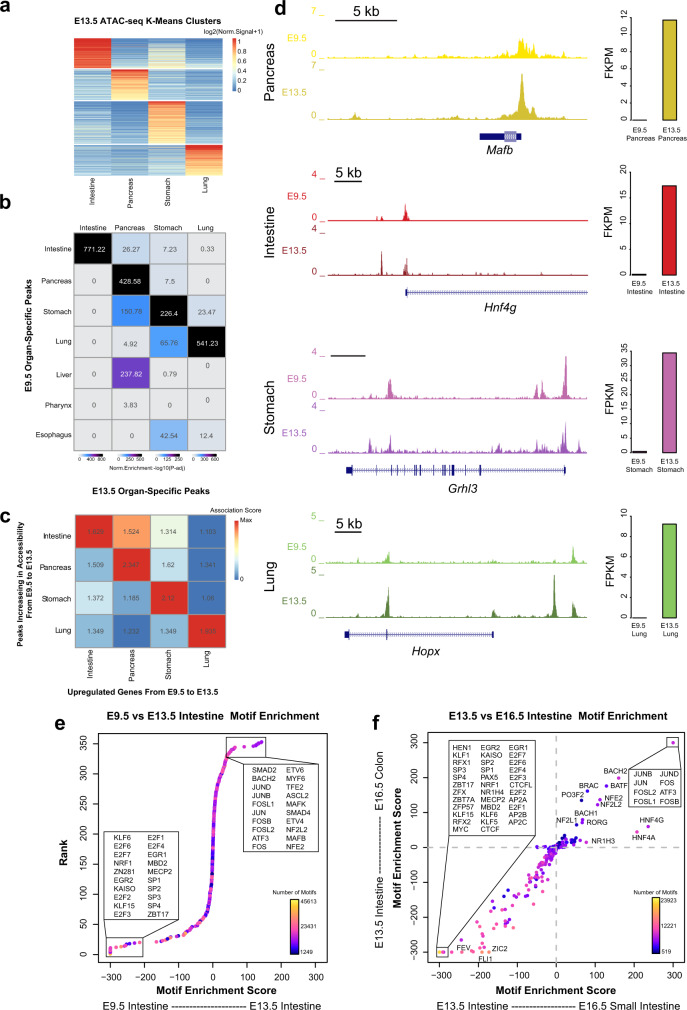
Fig. 2. Temporal changes in transcription are reinforced by changes in chromatin accessibility at TF binding sites.
a Heatmap of identified organ-specific peak clusters of bulk endodermal ATAC-seq samples from the E13.5 intestine, pancreas, lung, and stomach, colored by normalized ATAC-seq signal strengths. b Heatmap showing the significance of overlap between E13.5 organ-specific peaks and E9.5 organ-specific peaks. Values indicate the overlap significance quantified by −log10 (P-adj) using the one-sided hypergeometric test. c Heatmap of association scores (see “Methods” for details) between top 200 upregulated genes and top 2000 accessibility-increased peaks from E9.5 to E13.5 within and between each organ. d Example genes show the acquisition of lineage-specific patterns of chromatin accessibility (left) and transcriptional output (right) as development proceeds from E9.5 to E13.5. Y-axis on the genome-browser snapshots (left) represents normalized read count of pseudo-bulk (E9.5) or bulk (E13.5) ATAC-seq. Y-axis of the transcription barplots (right) represents normalized RNA-seq expression levels (FPKM) of E9.5 (scRNA-seq, N = 1153 cells) or E13.5 (bulk, N = 8 samples) organs. e DNA sequence motif enrichment in the open chromatin regions, ranked by relative motif enrichment scores (x-axis, see “Methods” for details) between E9.5 intestine and E13.5 intestine. 353 mouse TF motifs are included. Y-axis indicates the rank. The top 20 TFs on each side are labeled. Each data point is colored based on the total number of hits of TF’s motif in the open chromatin regions. f Scatter plot shows relative motif enrichment scores. The x-coordinate of each TF is its relative motif enrichment score calculated between the E13.5 intestine and E16.5 small intestine. The y-coordinate of each TF is its relative motif enrichment score calculated between E13.5 intestine and E16.5 colon. The top motifs on each end are labeled.

