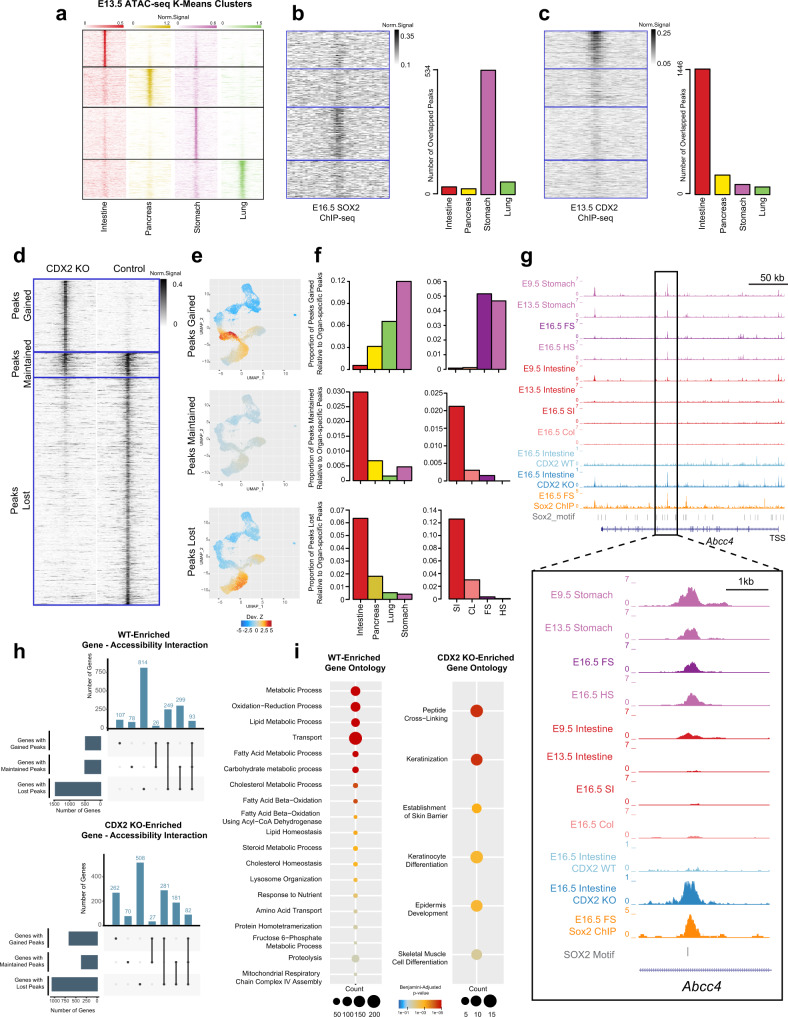
Fig. 3. SOX2 and CDX2 binding sites are associated with lineage specification patterns of chromatin accessibility.
a ATAC-seq signal pattern on E13.5 organ-specific peaks in the intestine, pancreas, stomach, and lung. Peaks are ordered by K-means clustering of ATAC-seq signal in the 4 organs. Color scale represents normalized ATAC-seq signals. b, c SOX2 ChIP-seq (n = 2) signal pattern in E16.5 stomach (b) and CDX2 ChIP-seq (n = 2) signal pattern in E13.5 intestine (c), aligned to the same region as (a) (left). Gray scale represents normalized ChIP-seq signals. Barplots showing numbers of organ-specific ATAC-seq (N = 7 ) peaks overlapped with SOX2 (b) or CDX2 (c) binding sites (right). d ATAC-seq signal pattern around genome-wide chromatin accessibility peaks in the E16.5 intestine from Cdx2 KO (left) and control (right) samples. Peaks are grouped into three categories based on how chromatin accessibility changes upon Cdx2 KO: Gained (top), Maintained (middle), and Lost (bottom). Gray scale represents normalized ATAC-seq signals. e Single-cell scatter plots under the same UMAP representation of E9.5 scATAC-seq as Fig. 1b, with each cell colored by its ChromVAR deviation Z-score for Cdx2 KO Peaks Gained, Maintained, or Lost. f Proportion of chromatin accessibility peaks Gained, Maintained, or Lost upon Cdx2 KO that are overlapped with E13.5 organ-specific chromatin accessibility peaks in the intestine, pancreas, lung, and stomach (N = 7, left) and with E16.5 organ-specific chromatin accessibility peaks in the small intestine (SI), colon (CL), forestomach (FS), and hindstomach (HS) (N = 8, right). g Genome browser snapshot at the Abcc4 locus depicting chromatin accessibility at a SOX2 binding site in the E9.5 and 13.5 stomach and intestine, the E16.5 SI, CL, FS, and HS, and the E16.5 control and Cdx2 KO intestine. h UpSet plot showing the intersections of WT (n = 3, top) and Cdx2-KO (n = 3, bottom) differentially expressed genes associated with different peak categories. i Enriched biological process GO terms of WT-specific genes with lost peaks (left) and Cdx2-KO-specific genes with gained peaks (right). Bubble size represents number of genes; Color represents significance based on Benjamini–adjusted P-value of one-sided fisher exact test from DAVID GO analysis.

