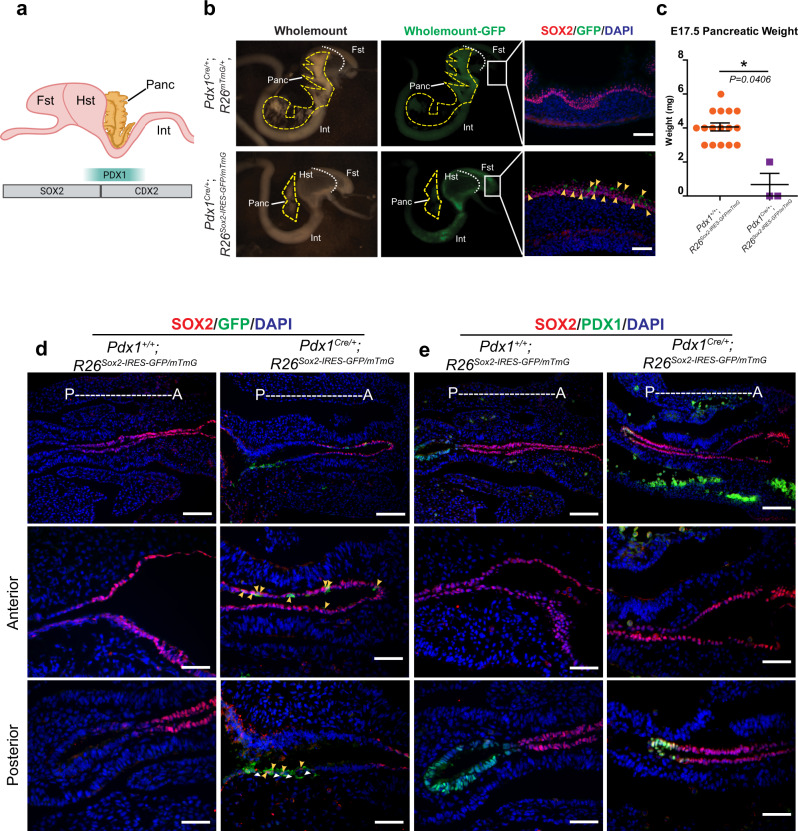
Fig. 4. Embryonic overexpression of Sox2 alters lineage fate decisions in the pancreas.
a Schematic overview of SOX2, PDX1, and CDX2 expression in the developing forestomach (Fst), hindstomach (Hst), intestine (int), and pancreas (Panc). b Whole-mount light (left) and GFP (middle) images of E17.5 Pdx1Cre/+;R26mTmG/+ (n = 3, top) and Pdx1Cre/+;R26Sox2-IRES-GFP/mTmG mice (n = 3, bottom) with GFP (green) and SOX2 (red) immunofluorescence images of Fst tissue (right). White dotted line denotes the boundary between Fst and Hst. Yellow dashed lines outline the pancreas. Yellow arrowheads indicate GFP-expressing cells in the Fst. Scale bar = 50 µm. c Mean (±SEM) pancreas weight (mg) from E17.5 Pdx1+/+;R26Sox2-IRES-GFP/mTmG (n = 16) and Pdx1Cre/+;R26Sox2-IRES-GFP/mTmG mice (n = 3) (*P = 0.0406 using a two-sided, unpaired t-test with Welch’s Correction). Source data are provided as a source data file. d Immunofluorescence images of SOX2 (red) and GFP (green) in E9.5 Pdx1+/+;R26Sox2-IRES-GFP/mTmG (n = 3, left) and Pdx1Cre/+;R26Sox2-IRES-GFP/mTmG (n = 3, right) mice. The top row shows both anterior and posterior domains (scale bar = 100 µm), while the middle and bottom rows show the anterior and posterior domains, respectively (scale bar = 50 µm). Yellow arrowheads indicate SOX2 and GFP double-positive cells. White arrowheads indicate GFP positive, SOX2 negative cells. e Immunofluorescence images of SOX2 (red) and PDX1 (green) in E9.5 Pdx1+/+;R26Sox2-IRES-GFP/mTmG (n = 3, left) and Pdx1Cre/+;R26Sox2-IRES-GFP/mTmG (n = 3, right) mice. The top row shows both anterior and posterior domains (scale bar = 100 µm), while the middle and bottom rows show the anterior and posterior domains, respectively (scale bar = 50 µm).

