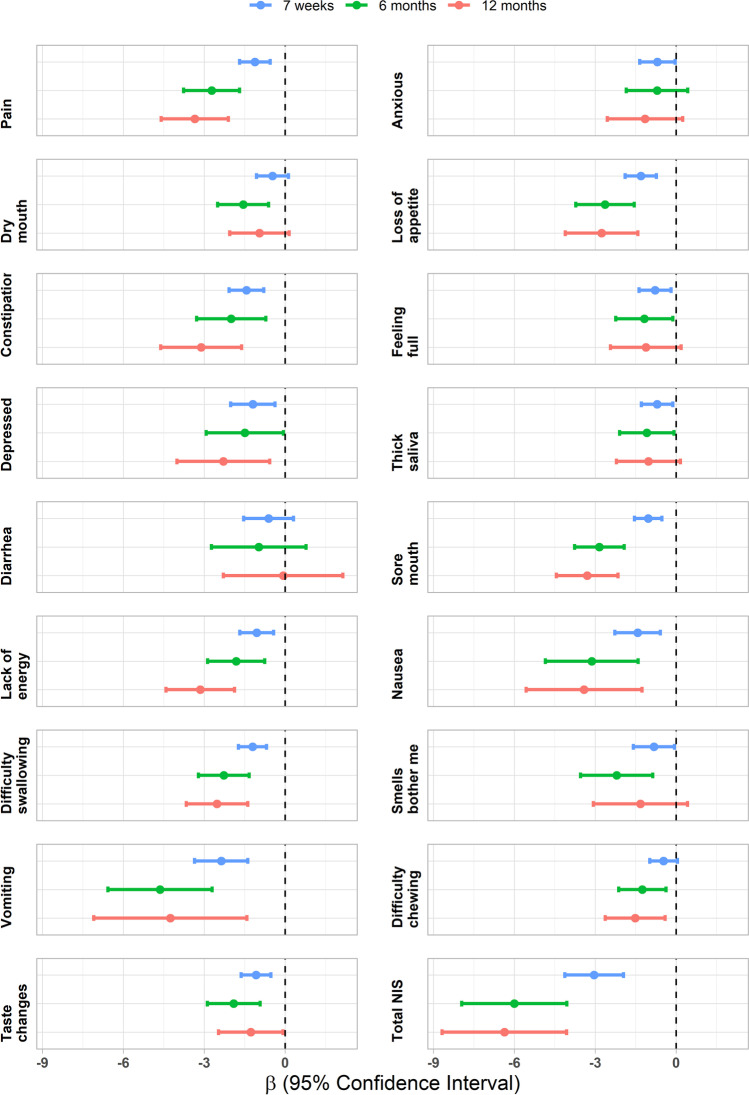
Fig. 2.
Forest plot showing the slope (β) for the effects of cumulative nutritional impact symptoms (NIS) on percentage weight loss (7 weeks, 6 and 12 months), with 95% confidence intervals. β is the expected percentage change in body weight from baseline when increasing the cumulative NIS with one point. For enabling comparisons to the individual NIS, NIS total score has here been transformed to a scale between 1 and 5 points before analysis

