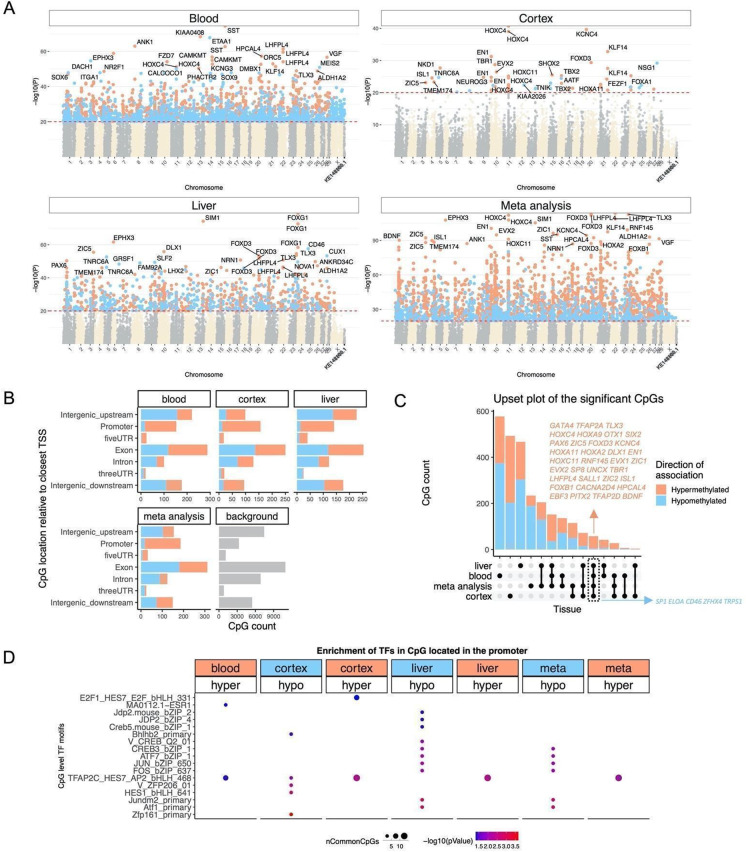
Fig. 5.
Epigenome-wide association study of age in tissues from Chlorocebus sabaeus. A Manhattan plots of the EWAS results in different tissues. Stouffer meta-analysis was used to combine the results across different tissues. The coordinates are estimated based on the alignment of Mammalian array probes to ChlSab1.1.100 genome assembly from ENSEMBL. The direction of associations with p < 10 × −20 (red dotted line) is colored in red (increased methylation with age) and blue (decreased methylation). The top 30 CpGs were labeled by their neighboring genes. B Location of top CpGs in each tissue relative to the closest transcriptional start site. Top CpGs were selected at p < 10−10 and further filtering based on z score of association with chronological age for up to 500 in a positive or negative direction. The number of selected CpGs: blood, 1000; cortex, 777; liver, 1000; meta-analysis, 1,000. The gray color in the last panel represents the location of 35,898 mammalian BeadChip array probes mapped to ChlSab1.1.100 genome. C Upset plot representing the overlap of aging-associated CpGs based on meta-analysis or individual tissues. Neighboring genes of the overlapping CpGs were labeled in the figure. D Transcriptional motif enrichment for the top CpGs in the promoter and 5′ UTR of the neighboring genes. The motifs were predicted using the MEME motif discovery algorithm, and the enrichment was tested using a hypergeometric test [72]. In total, 19,087 CpGs were predicted to be located on the motifs and were used as the background. nCommonCpGs indicates the number of target CpGs that overlapped with the background CpGs on the analyzed motif

