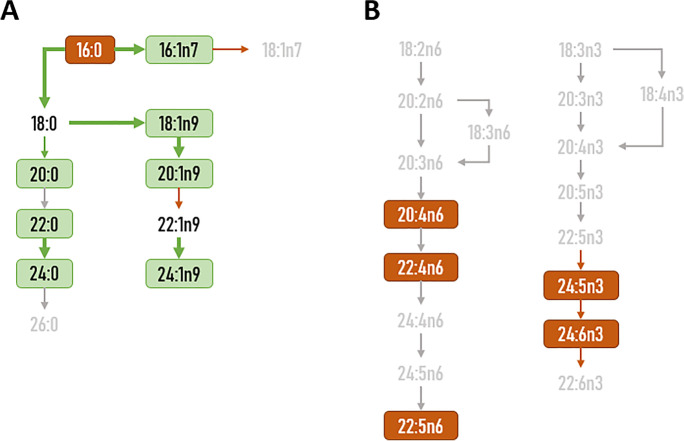
Fig. 5.
Cingulate cortex (A) and temporal cortex (B) changes in fatty acid composition associated with the aging process. Figure is based on data presented in Tables 1 and 2 and Figs. 4 and 6. Green boxes and rows represent increased content of individual FA or enhanced estimated activity in aged individuals compared to the middle-aged. Orange boxes and rows represent reduced content of individual FA or decreased estimated activity in aged individuals compared to the middle-aged. Gray text and rows represent unchanged content of individual FA or estimated activity in aged individuals compared to the middle-aged

