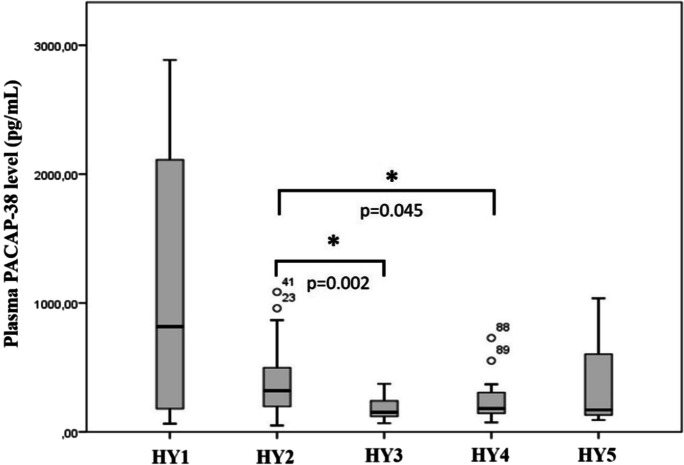
Fig. 2.
Examination of PACAP-38 levels in the different stages of the Hoehn and Yahr (HY) scale. HY1, unilateral symptoms (n = 4); HY2, bilateral symptoms (n = 64); HY3, mild to moderate disease (n = 17); HY4, severe disability (n = 17); HY5, wheelchair bounded or bedridden (n = 3). PACAP-38 levels were significantly lower in the HY3 and HY4 group compared to the HY2 group. The boxes show the interquartile ranges, and the whiskers indicate the 25% and 75% percentile; outliers are also plotted with numbered data points labeled with circles. The middle line within the boxes represents the median values. One-way ANOVA with Tukey’s post-hoc test, * p < 0.05, p = 0.002 HY2 vs. HY3, p = 0.045 HY2 vs. HY4

