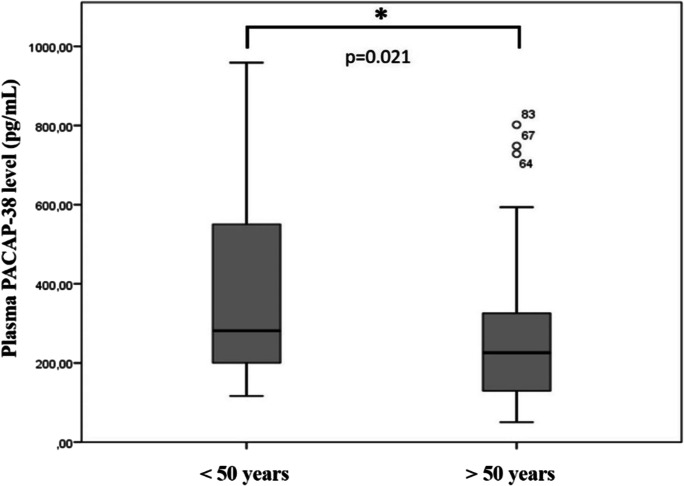
Fig. 3.
Examination of age-dependent changes of PACAP-38 levels in patients with Parkinson’s disease. Patients were divided into two age groups: younger (< 50 year) (n = 33) and older than 50 years of age (n = 73). In the older group, significantly reduced levels can be found compared to the younger group. The boxes show the interquartile ranges, and the whiskers indicate the 25% and 75% percentile; outliers are also plotted with numbered data points labeled with circles. The middle line within the boxes represents the median values. Mann–Whitney U test, * p < 0.05, p = 0.021 vs. < 50 years

