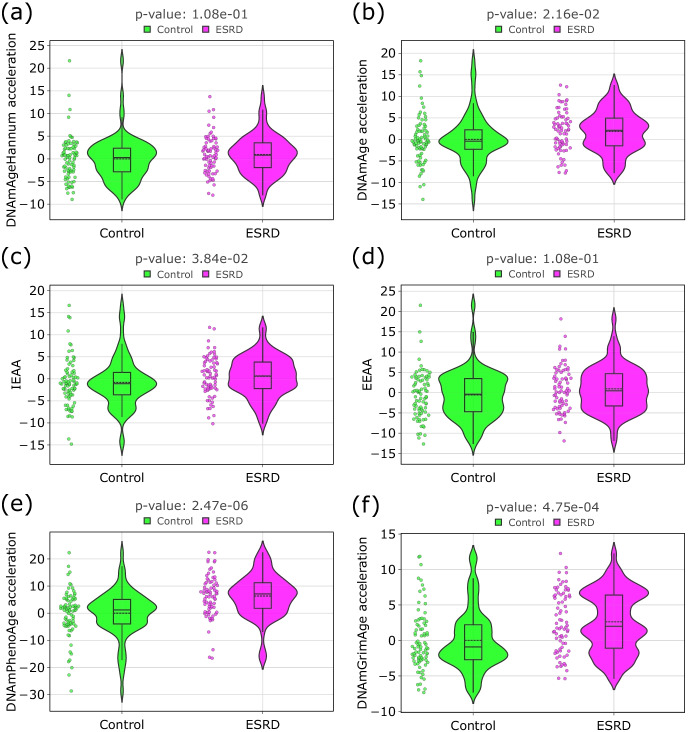
Fig. 2.
Violin plots for age acceleration differences in controls and participants with the ESRD: a DNAmAgeHannum [43]; b DNAmAge [44]; c IEAA [15, 16]; d EEAA [15, 16]; e DNAmPhenoAge [42]; f DNAmGrimAge [45]. The black line on the boxplot corresponds to the median value, dashed line—to mean value. For each type of epigenetic age, a linear regression model which estimates chronological age was built only on the group of control participants. Epigenetic age acceleration was calculated as a residual from this linear model. IEAA was calculated as the residual from a multivariate regression model of DNAm age on chronological age and blood immune cell counts only on the control group. EEAA is the residual resulting from a univariate model that regressed the weighted average of the epigenetic age measure from Hannum and three estimated measures of blood cells (naïve (CD45RA + CCR7 +) cytotoxic T cells, exhausted (CD28-CD45RA-) cytotoxic T cells, plasma B cells) on chronological age (only on control group). Mann–Whitney U test was applied to analyze the statistically significant difference of epigenetic age acceleration between controls and participants with ESRD. The resulting p-values were FDR-corrected with the Benjamini–Hochberg approach

