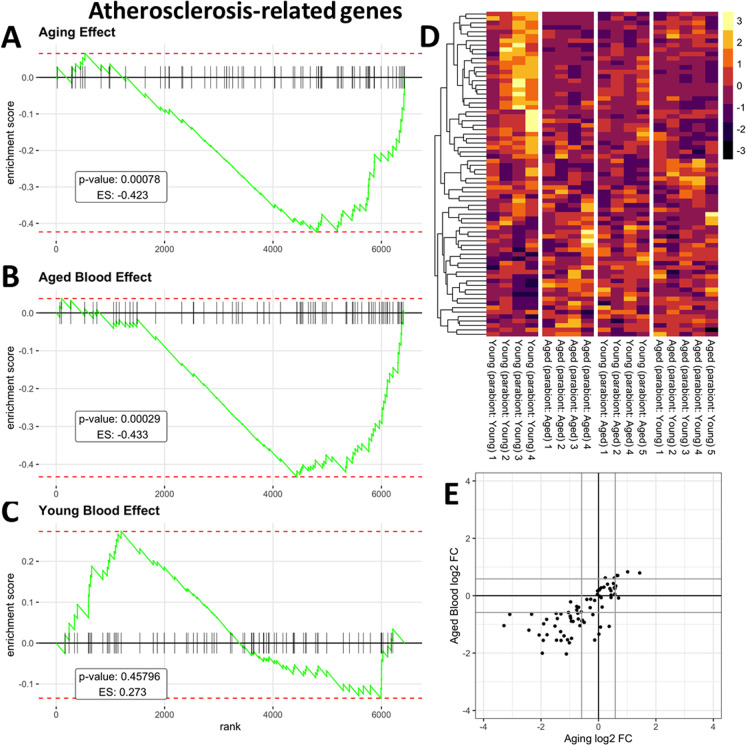
Fig. 6.
Presence of old blood in young mice mimics age-related changes in vascular expression of genes associated with the pathogenesis of atherosclerosis Panel A: Gene set enrichment analysis (GSEA) to test the effect of aging on the enrichment of the set of genes associated with the pathogenesis of atherosclerosis by comparing aorta samples derived from isochronic parabiont young mice [parabiont: young; Y–(Y)] and isochronic parabiont aged mice [parabiont: aged; A–(A)]. Aging-induced gene expression changes were ranked from most up-regulated (left) to most down-regulated (right). Ticks represent genes encoding atherosclerosis-related factors. Shown is a running-sum statistic (enrichment score) based on panel D, increasing when a gene is a member of the atherosclerosis-related gene set and decreasing when it is not. Panel B: GSEA showing the effect of exposure to old blood on enrichment of atherosclerosis-related genes. Aorta samples derived from isochronic parabiont young mice [parabiont: young; Y–(Y)] and heterochronic parabiont young mice [parabiont: aged; Y–(A)] were compared. Note that in aged mice enrichment scores increased predominantly on the right indicating age-related dysregulation of genes related to atheroprotection. In response to the presence of old blood in young mice enrichment scores showed similar increases on the right, indicating that the presence of old blood in young mice mimics the effects of aging. Panel C: Youngblood had no consistent effect on atherosclerosis-related genes (comparison: A–(Y) vs. A–(A)). Panel D: The heatmaps are graphic representations of normalized expression values of atherosclerosis-related genes. Hierarchical clustering analysis revealed the similarities on aortic expression profiles of atherosclerosis-related genes in aged mice and old blood exposed young mice. Panel E: Old blood-induced changes in atherosclerosis-related gene expression (log2 fold changes; Y–(A) vs. Y–(Y)) plotted against age-related changes (log2 fold changes; A–(A) vs. Y–(Y)) in atherosclerosis-related gene expression. Note that many genes are similarly dysregulated both in aging and by the presence of old blood in young animals as well

