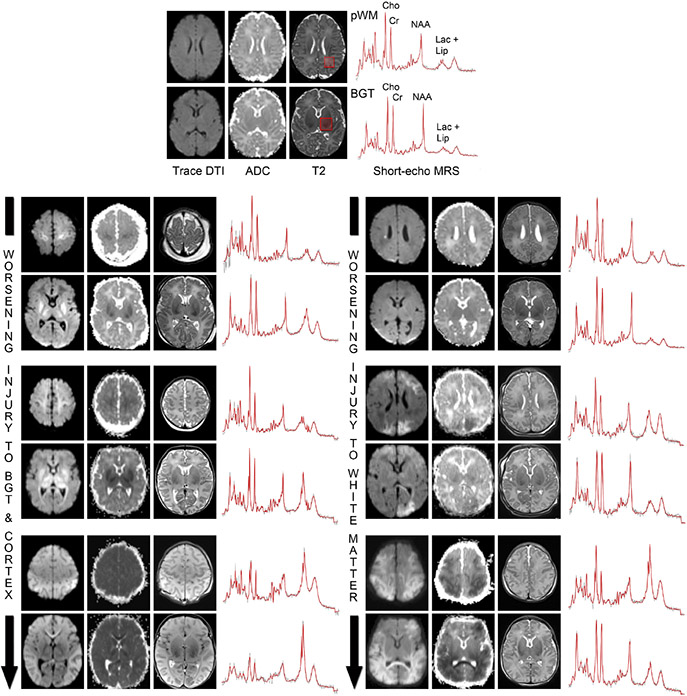
Fig. 3.
MRI and MRS biomarkers indicate the degree of injury to the BGT, cortex, and white matter. The top panel depicts Trace-DTI, ADC, and T2-weighted images obtained at the level of the parietal white matter (pWM, upper) and BGT (lower) from a typically developing term neonate, with the major metabolite peaks labeled for reference. Short-echo MRS spectra obtained from the corresponding voxels (red boxes on the anatomical images) in the BGT and pWM are shown to the right. The lower panels depict Trace-DTI, ADC, T2w and MRS spectra from six neonates with NE imaged at days 4–5 of life. Note how the lactate-lipid signals in the BGT and pWM voxels increase in line with the degree of injury to the BGT-cortex and white matter, respectively, while NAA decreases. Cho = choline; Cr = creatine; NAA = nacetylaspartate; lac + lip = combined signal from lactate and lipids.

