Figure 3.
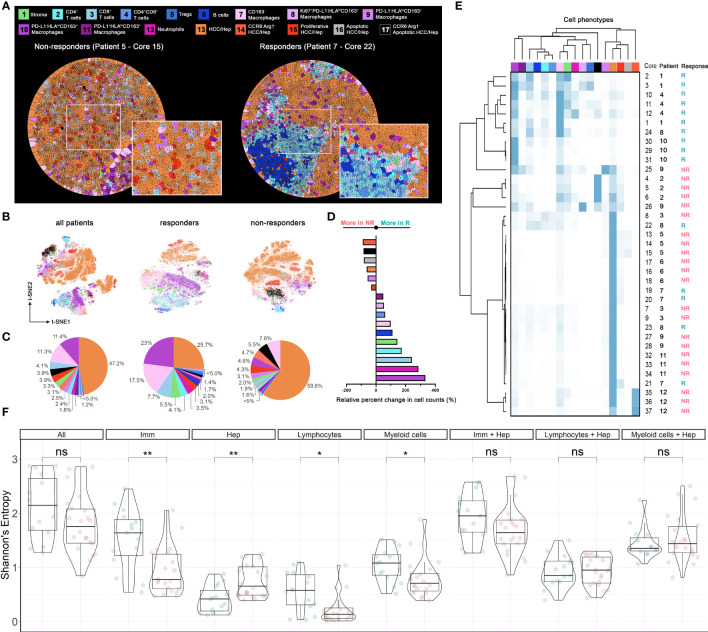
Cell populational characteristics and heterogeneity. (A) Voronoi tessellation results for exemplar responder and non-responder cores. Each partitioned polygon was color-coded by corresponding cell type. Cell distributions evaluated using (B) t-SNE visualization (n = 58,740), (C) pie-chart, (D) waterfall, and (E) heatmap and hierarchical clustering. (F) Spatial Shannon’s entropy computed for different sets of cell types. Significant differences were observed for immune cell subset, tumor cell subset, lymphocytes subset, and myeloid cell subsets between responder samples (n = 15) and non-responder samples (n = 22). P values were computed using Wilcox rank-sum test and adjusted using FDR. *p value < 0.05; **p value < 0.01. ns, not significant.

