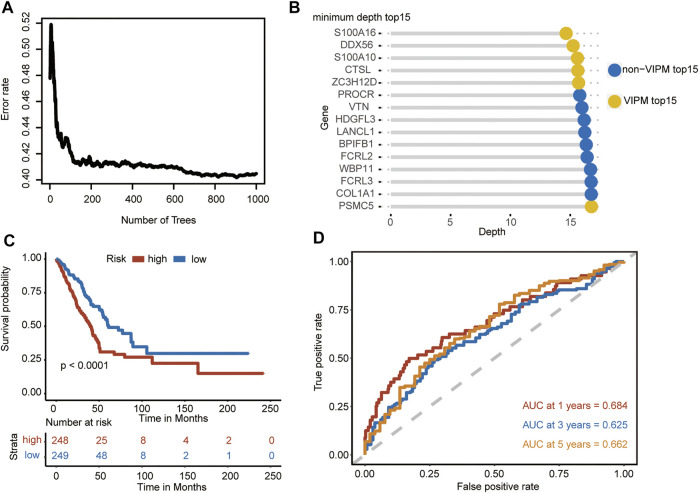
FIGURE 1.
Gene selection and model construction. (A) Error plots using the out-of-bag prediction of error estimator based on trees. (B) Overlap genes (annotated yellow) ranked by minimum depth and VIPM. (C) Kaplan–Meier curves and log-rank test of the overall survival based on the low- and high-risk groups in the TCGA–LUAD. (D) ROC curves for evaluating the prediction performance of the signature in the TCGA–LUAD.

