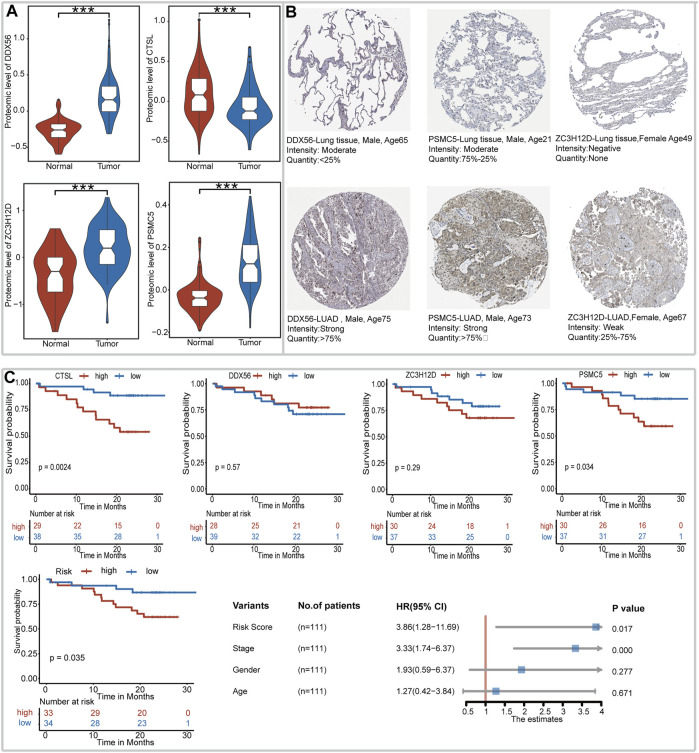
FIGURE 4.
Expression profile of genes in IRBPS at the protein level. (A) Gene expression differences between LUAD tissues and normal lung tissues at the protein level. (B) Immunohistochemical staining for DDX56, ZC3H12D, and PSMC5 in LUAD tissues and normal lung tissues. (C) Kaplan–Meier curves, log-rank test, and multivariate Cox analysis of the overall survival based on the expression level of these genes and IRBPS at the protein level.

