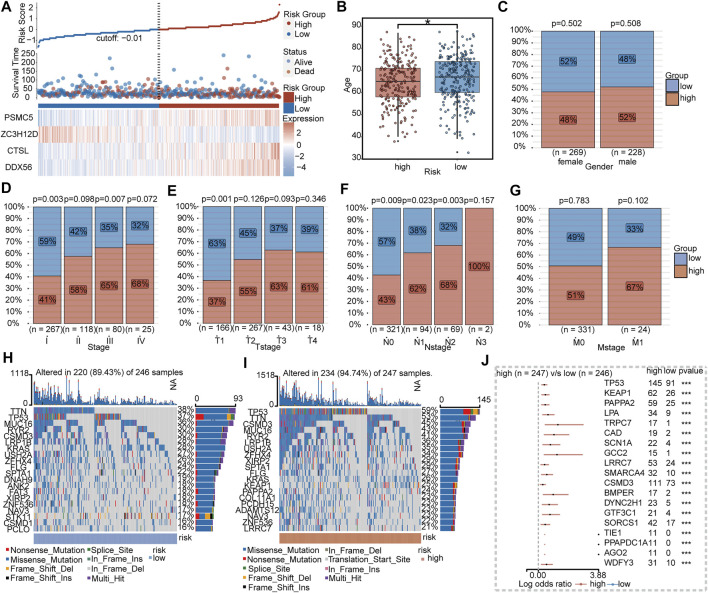
FIGURE 5.
Clinical and mutational features between IRBPS subgroups. (A) Distribution of survival status and the four-gene expressions trend between IRBPS subgroups. Clinical characteristic differences between IRBPS subgroups in terms of age (B), gender (C), stage (D), T-stage (E), N-stage (F), and M-stage (G). (H,I) Ranked the top 20 of gene mutations in low- and high-risk groups. (J) The significant mutation genes in the high-risk group compared to the low-risk group.

