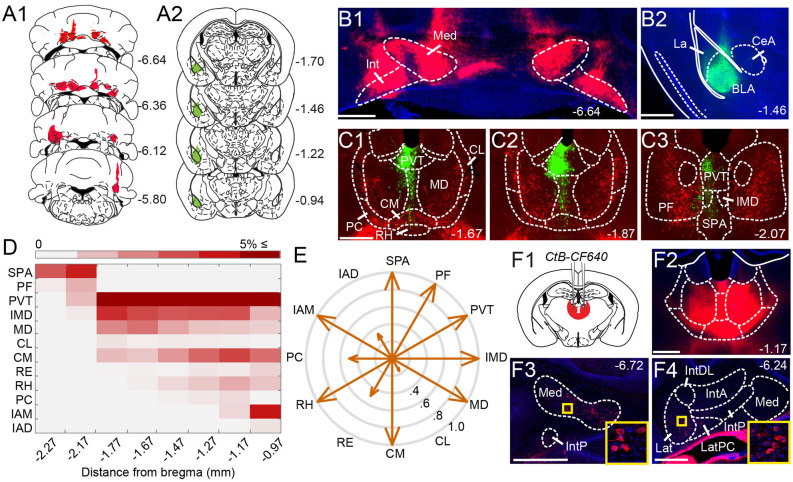
Figure 1.
Anatomical tracing uncovers putative disynaptic pathways from the cerebellum tobasolateral amygdala. (A) Injection sites for anterogradeviral tracer in DCN (A1, red) and retrograde viraltracer in BLA (A2, green). (B) Mosaic epifluorescence image of injection sites in DCN (B1) and BLA (B2). (C1–C3) Mosaic epifluorescence images of overlapping DCN axons (red) and BLA-projecting neurons (green) in limbic thalamus. (D) Relative distribution of BLA-projecting neurons across nuclei of the limbic thalamus, normalized to the total number of labeled neurons and averaged across experiments, as a function of distance from bregma. Antero-posterior coordinates for each nucleus are given in Table 1. (E) Quantification of overlap between DCN axons and BLA-projecting thalamic neurons. Arrow length in compass plot indicates proportion (0.0–1.0) of experiments with overlap in each thalamic nucleus. (F1,F2) Schematic and confocal image of injection site for retrograde tracer CtB CF-640 in limbic thalamus. (F3,F4) CtB-labeled projection neurons (red) in DCN at different distances from bregma. Insets show high-magnification images of areas in yellow squares. For all panels, numbers denote distance (in mm) from bregma. Blue: DAPI. Scale bars: 500 μm.

