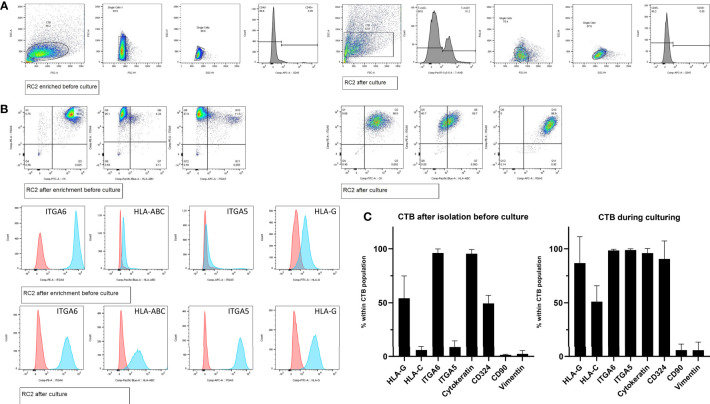
Figure 2.
Cell frequencies by flow cytometry after enrichment and during CTB culturing. (A) Representative gating strategy from one donor (RC2), to select singlet cells by forward-sideward scatter that were viable (7-AADneg) and non-hematopoietic (CD45neg). (B) Representative flow cytometry dot blots and histogram plots of trophoblasts from one donor (RC2), after cell enrichment but before culturing (upper panel) and during culturing in CTB stem cell medium (lower panel). (C) Mean cell frequencies from seven donors showing the positivity for each of the markers of interest, both after cell enrichment but before culturing (left graph) and during culturing in CTB stem cell medium (right graph).

