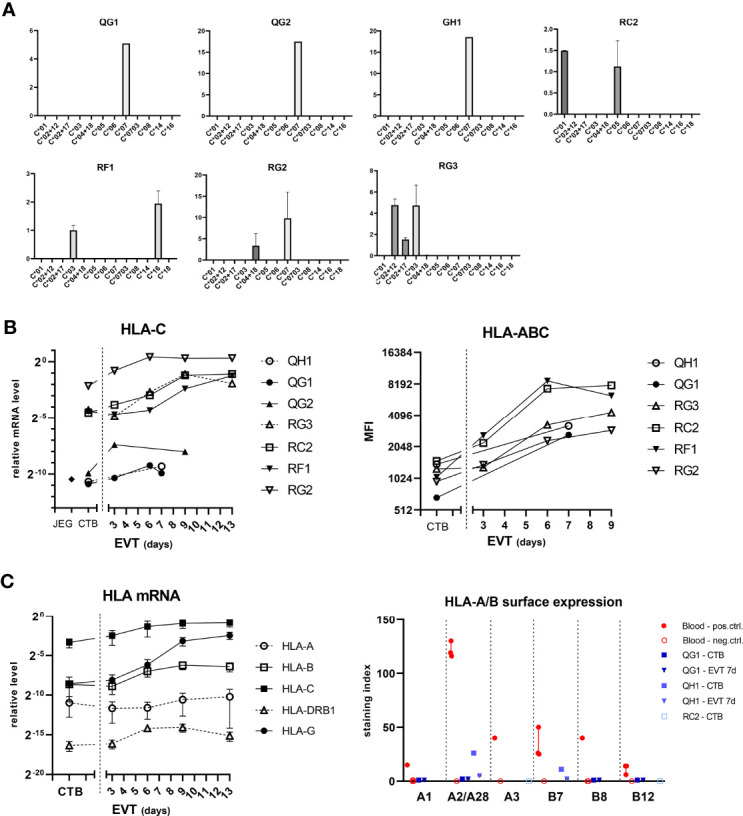
Figure 5.

Expression of HLA-C in trophoblasts. (A) Messenger RNA expression of HLA-C according to the HLA-C alleles. RNA from CTB cultures (n = 7) was analyzed by quantitative PCR using primer sets that are specific for different HLA-C alleles. The vertical axes represent relative mRNA expression of HLA-C alleles, corrected for the average signal of two reference genes (GAPDH, ACTB). The graph shows means with SEM of two independent experiments per culture. (B) HLA-C mRNA expression was determined by quantitative PCR using generic primers that targeted all alleles (left panel). HLA-C was also studied by flow cytometry using antibodies against pan-HLA class I (right panel). (C) Messenger RNA expression of HLA-A, -B, -C, -DRB1, and -G (left panel) was studied in CTB and EVT cultures. RNA was analyzed by quantitative PCR using locus-specific primer sets. The graph shows means with SEM. Surface expression of individual HLA-A and HLA-B alleles was investigated by flow cytometry using human monoclonal antibodies on four blood cell samples and two trophoblast cultures (right panel). The graph displays medians with interquartile ranges.
