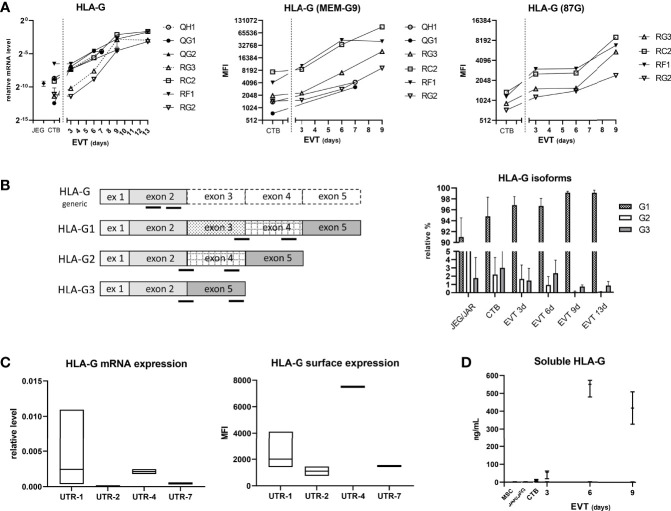
Figure 6.
Expression of HLA-G in trophoblasts. (A) HLA-G mRNA expression was determined by quantitative PCR using generic primers that targeted all alleles (left panel). HLA-G was also studied by flow cytometry using antibodies against HLA class I and two epitopes on HLA-G1 and -G5 isoforms (MEM-G9 and 87G), respectively (middle and right panel). (B) HLA-G1, G2, and G3 isoforms were separately studied by using isoform-specific primer sets (annealing locations indicated by black bars in the left panel). The results in the right panel are displayed as means with SD of n = 4 primary cultures. (C) HLA-G expression according to HLA-G 3’-UTR haplotype. Messenger RNA expression of HLA-G from seven CTB cultures was analyzed by quantitative PCR (corrected for the average signal of reference genes GAPDH and ACTB; left panel), whereas information of HLA-G surface expression by flow cytometry against MEMG9 was available for six CTB cultures (right panel). Expression data were grouped according to haplotype: UTR-1 (n = 4), UTR-2 (n = 2), UTR-4 (n = 2) or UTR-7 (n = 1). The graphs show floating bars (min to max with line at median). (D) Soluble HLA-G levels were determined by ELISA in supernatant of CTB (n = 3), EVT (n = 3), JEG-3 and JAR cell lines, and MSC (n = 2). The graph shows medians with the whiskers representing minimum and maximum values.

