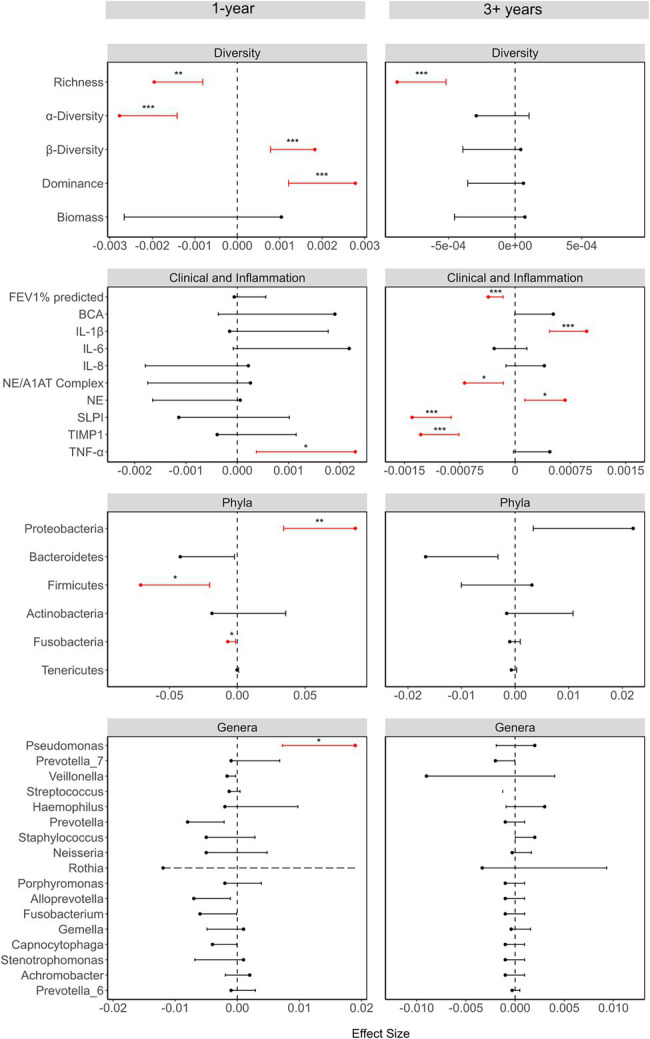
Figure 2.

Summary of the linear models investigating the relationship between each variable and time, showing the effect sizes, 95% CI and values of p (as asterisks). The effect sizes and values of p were calculated using either linear mixed-effects models (LMMs), generalized linear mixed models (GLMMs), or zero-inflated Gaussian models (ZIGMMs) as outlined in the Supplementary Methods. Where variables were transformed before use in a model, the effects sizes are from the models with the transformed data. For the LMMs, the response variables were standardized, by subtracting the mean and dividing by the standard deviation, for ease of comparison. For the taxonomic variables, time was converted to months rather than days. Only the error bars going toward zero are showing to maintain a scale that aids visualization. The dashed error bar for Rothia in the 1-year study represents the fact that the confidence interval extends beyond the limits of the figure, but the figure was cut to maintain a good scale for comparison. The values of p of phyla and genera were adjusted for multiple comparisons using the Benjamini-Hochberg method. Values of p indicated as: *<0.05, **≤0.01, and ***≤0.001.
