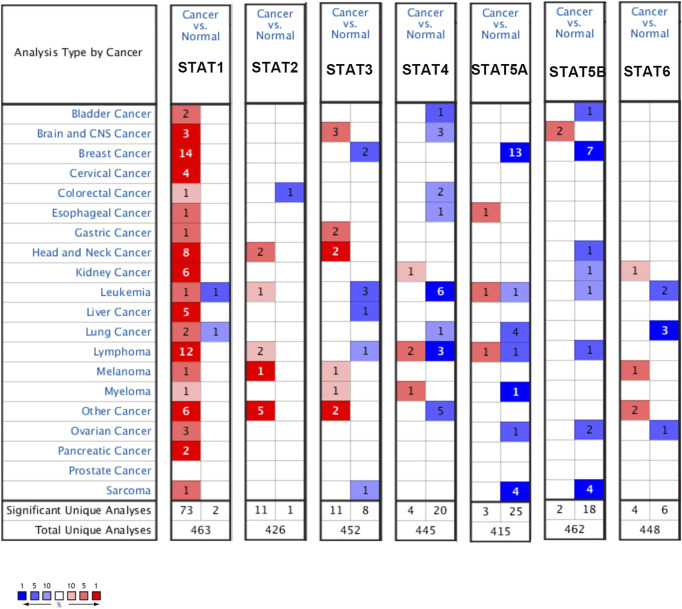
FIGURE 1.
Expression levels of the STAT family in different types of cancers (Oncomine). The panel shows the numbers of datasets with statistically significant mRNA overexpression (red) or downregulated expression (blue) of the STAT family. The threshold was designed with the following parameters: fold change of 1.5 and p-value of 0.05.

