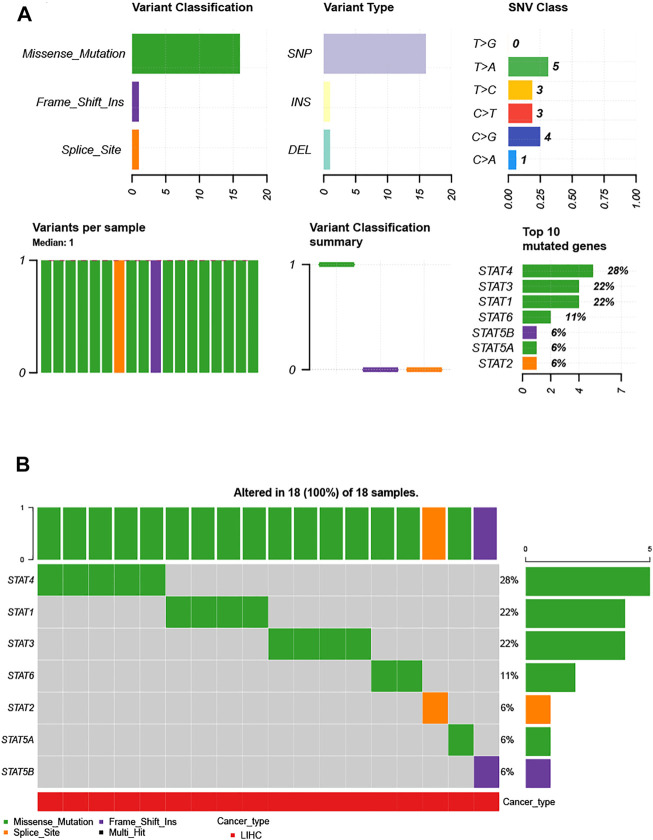
FIGURE 3.
Single-nucleotide variation (SNV) analysis of the STAT family in HCC (GSCALite). (A) Summary plot displaying SNV frequency and variant types of the STAT family in HCC, and genetic alterations of the STAT family constitute SNPs, insertions, and deletions. (B) Waterfall plot shows the mutation distribution of the STAT family in HCC, and STAT4 (28%), STAT3 (22%), and STAT1 (22%) were the top three most frequently mutated genes among all STAT family members.

