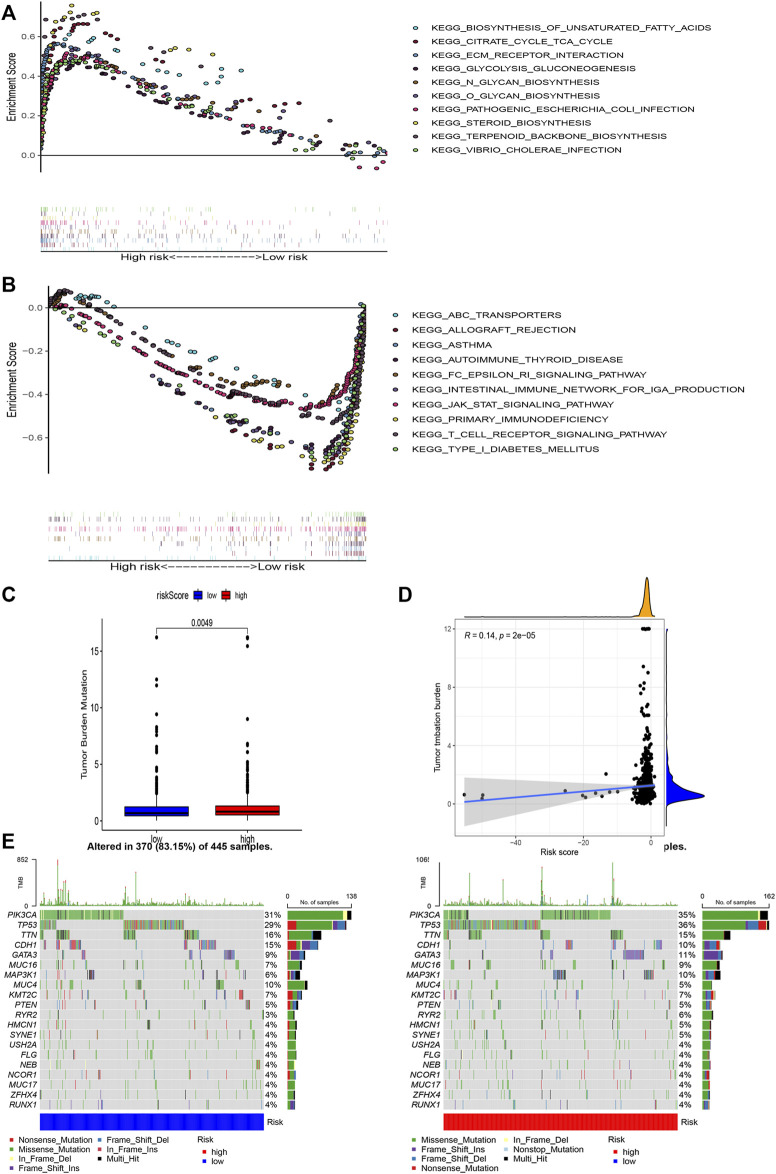
FIGURE 6.
Gene enrichment analysis for AAM-related lncRNAs based on TCGA in the high (A) and low (B) BRCA risk groups. Correlation between the TMB and the two risk subsets (C). Association between the TMB and risk score (D). Prominently mutated genes in the patients with BRCA in the different risk subgroups. The mutated genes (rows, top 20) are ranked according to mutation rate; samples (columns) are arranged to emphasize the mutual exclusivity among mutations. The right panels depicts the mutation percentage, and the top panel indicates the overall number of mutations. The color coding indicates the mutation type (E).

